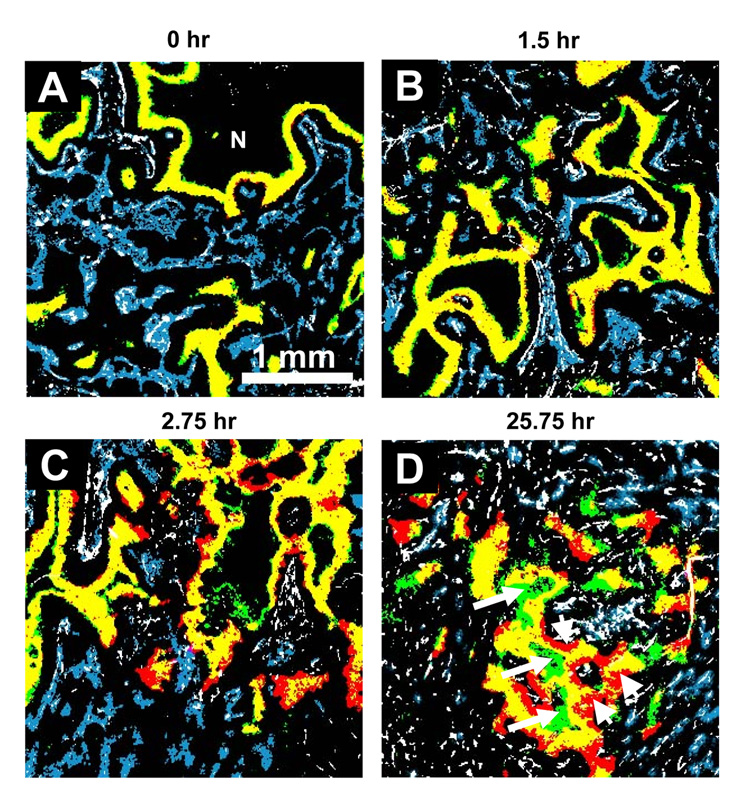
Figure 2.
Representative composite binary images of tumor sections from unheated control tumors. Different injection intervals for two hypoxia markers were given and indicated above each image. First hypoxia marker pimonidazole is stained green; the second hypoxia marker EF5, red; the overlay of two hypoxia markers (i.e. no change in the hypoxic status), yellow; vasculature endothelium CD31, white; and perfusion marker Hoechst 33342 is blue. N: necrosis. Original magnification 50×, Scale bar = 1 mm.

