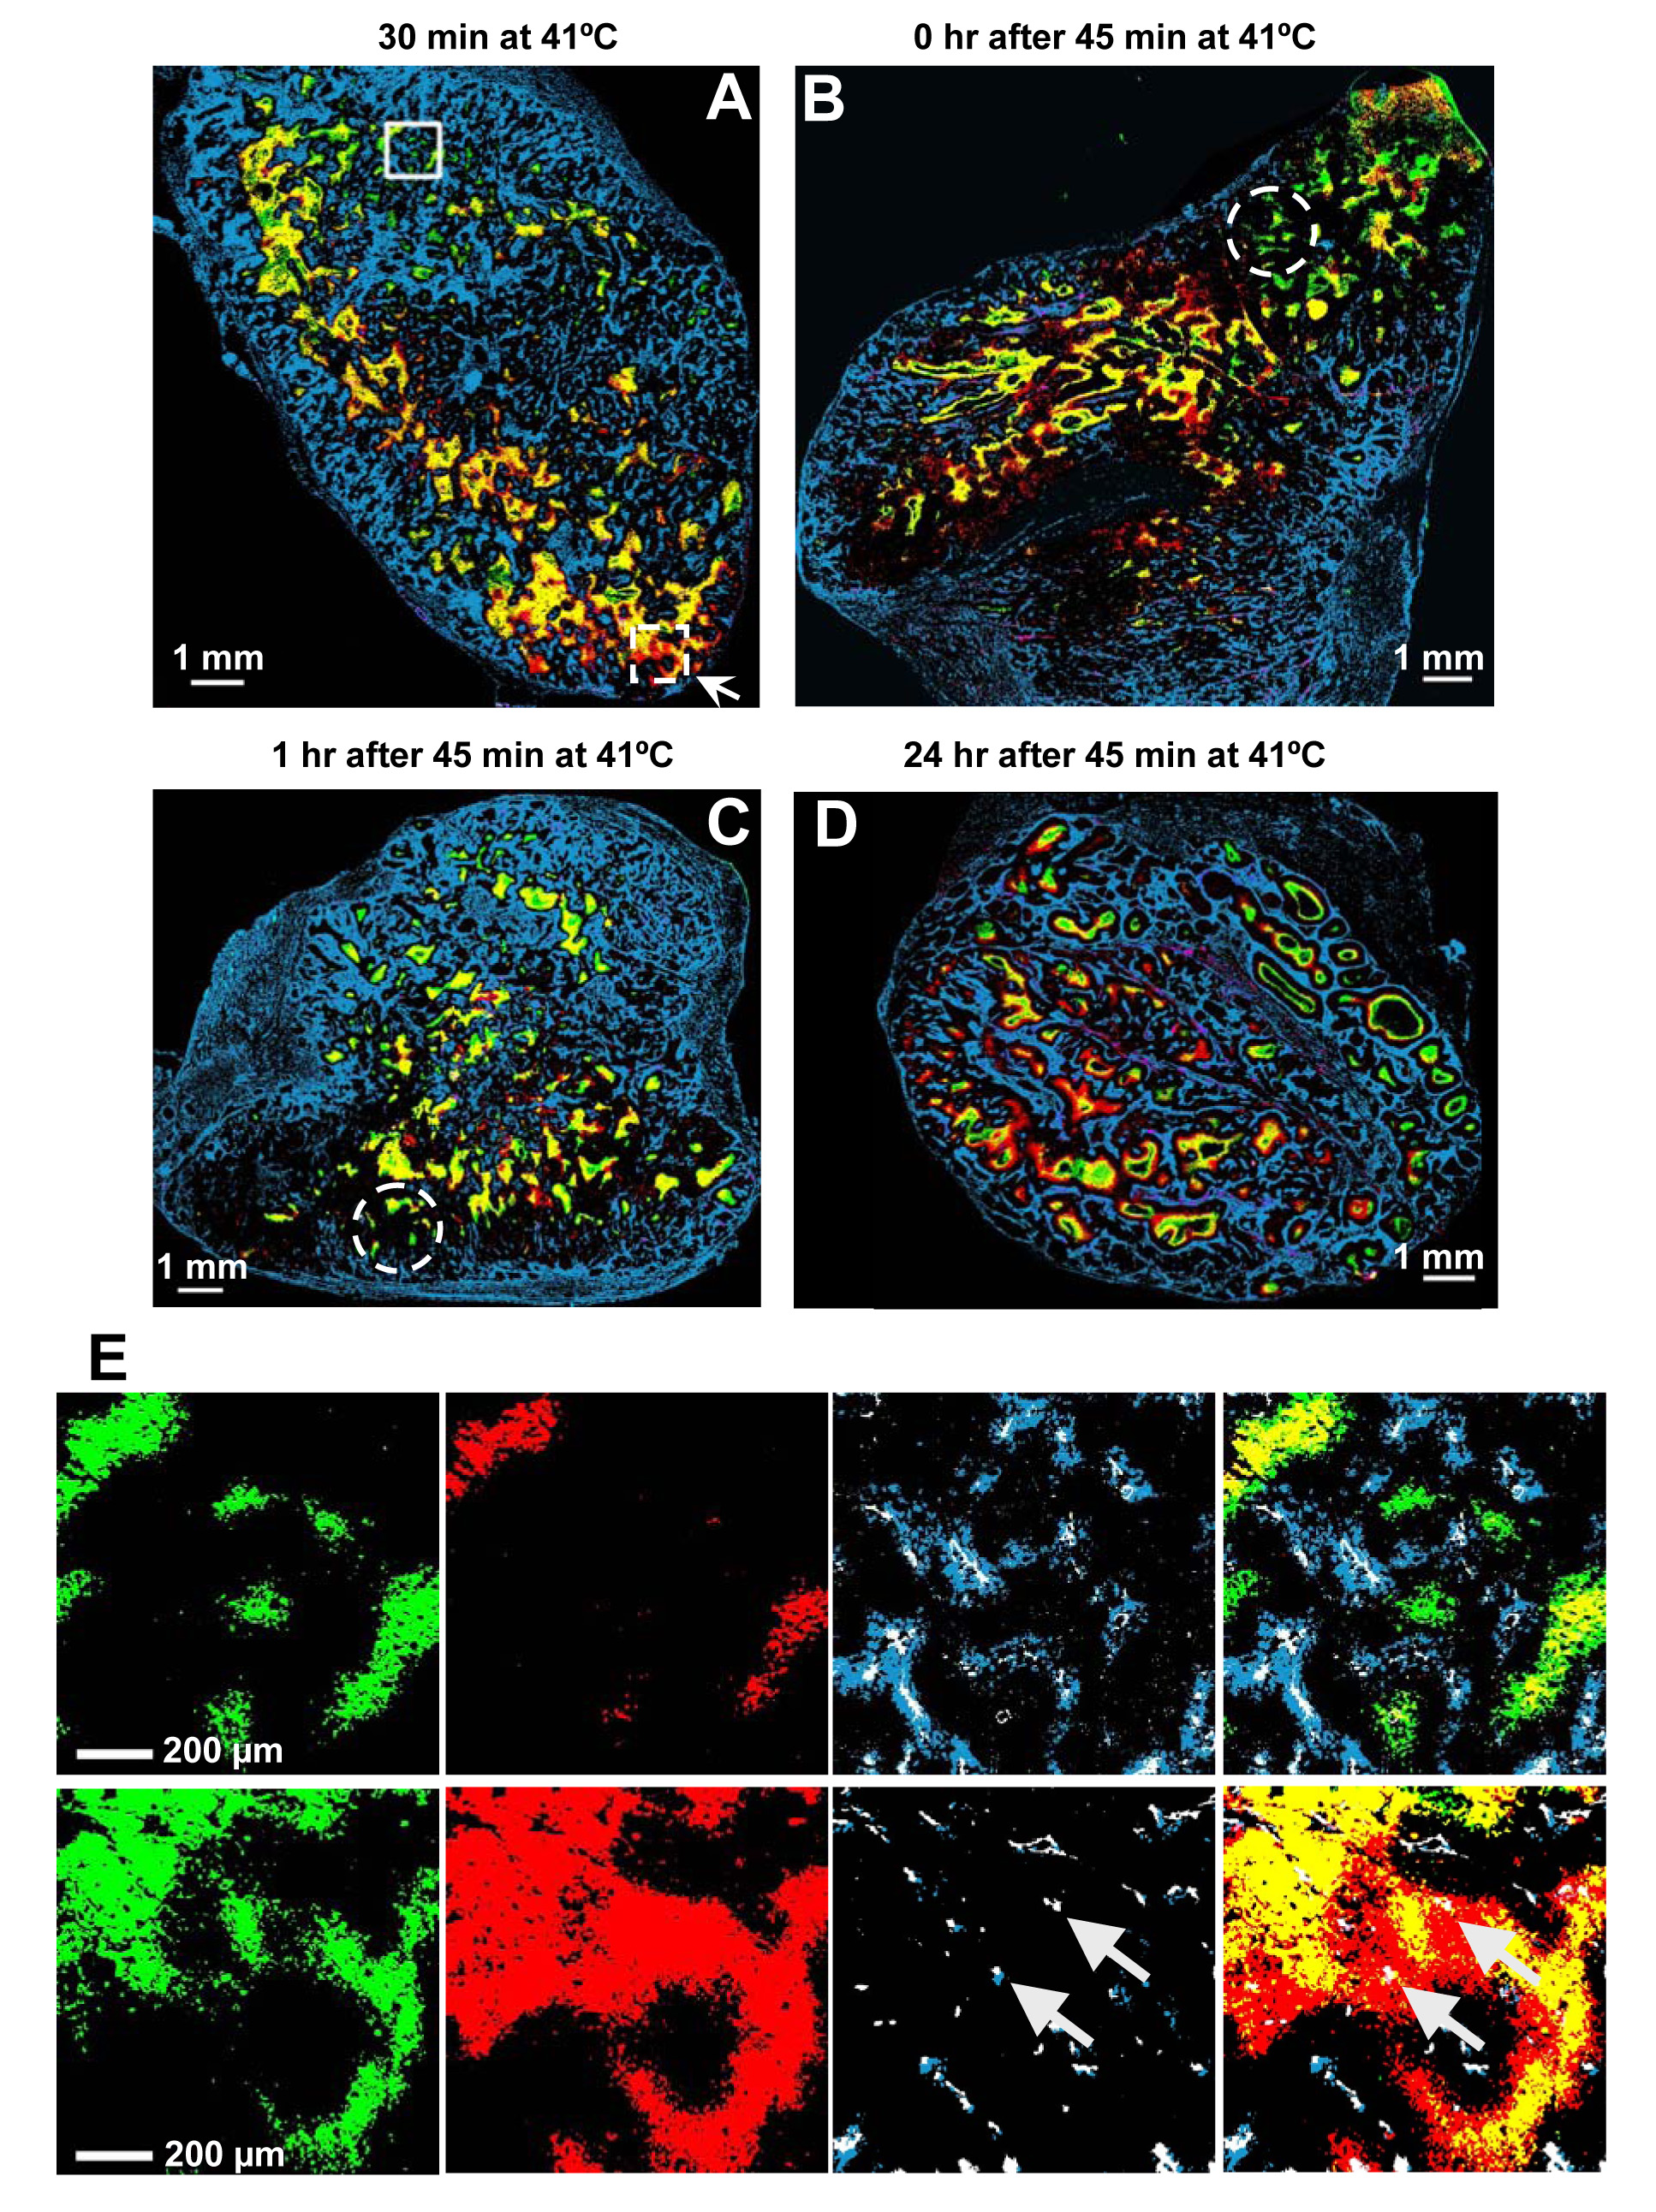
Figure 3.

Effect of MTH on tumor hypoxia. A–D Representative composite binary images from heated tumors at different time points during and after heating. The color convention is the same as Figure 2. The interval between EF5 injection and heating is given above each image. Original magnification 50×, Scale bar = 1 mm. E. Comparison of binary image detail from the two different regions of the heated tumor shown in Figure 3A (solid-line square for the upper panel, dashed-line square for the lower panel). From left to right, pimonidazole, EF5, CD31 and Hoechst 33342 together, and the composite binary image showing all markers. The upper panel shows an example region where the hypoxic foci decrease during heating; the lower panel shows a region where the hypoxic foci increase during heating. Original magnification 50×, Scale bar = 200 µm.
