Figure 2.
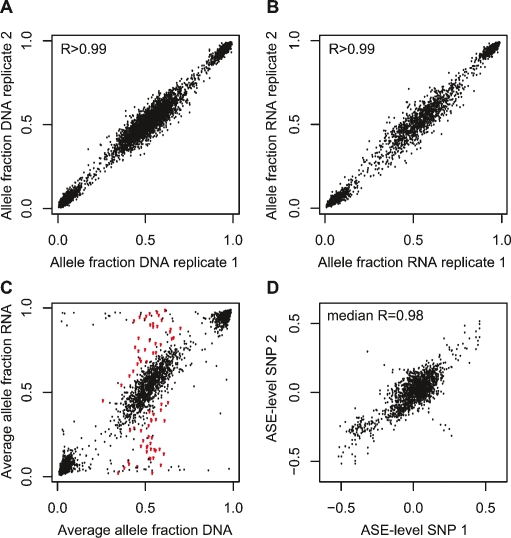
Genotyping by the NS-12 BeadChips to detect allele-specific gene expression. (A) Correlation between the allele fractions determined in replicate DNA samples for 3531 expressed SNPs in one ALL sample. The median correlation between the allele fraction obtained in replicate assays in all 197 samples was 0.9969 (range 0.9934–0.9986). (B) Correlation between the allele fractions determined by genotyping the same 3531 SNPs in replicate RNA samples from the same sample as in A. The median correlation between the allele fraction obtained in replicate assays in all 197 samples was 0.9956 (range 0.9779–0.9984). (C) Average allele fractions from triplicate assays of 3531 SNPs in RNA and DNA from the same sample as above. The red dots represent the allele fraction in RNA for SNPs that display allele-specific expression, i.e., SNPs that are heterozygous in DNA and show a significant difference (P < 0.001) in the mean allele fraction between RNA and DNA from the same cell sample as in A and B. (D) Pairwise correlation between allele-specific expression (ASE) levels determined using pairs of informative SNPs located in the same exon of 16 different genes. The ASE level for each SNP is given as the average difference in allele fraction between triplicate DNA and triplicate RNA samples. Shown are the results from 16 genes, of which 11 genes had two SNPs in the same exon, two genes had three SNPs in the same exon, and three genes had more than three SNPs in the same exon and were heterozygous in 9–112 samples, totaling 1658 observations. The pairwise correlation between ASE-levels determined with these SNPs ranged from 0.68 to 0.99 (median 0.98), with the exception of three SNPs in the FPR1 gene, between which there was an obvious inverse correlation between the ASE levels in a subset of the samples. As can be seen in Supplemental Figure 2 these SNPs are located outside the main linkage disequilibrium (LD) block of the FPR1 gene.

