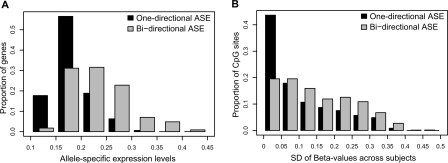
Figure 4.
Variation of ASE and CpG site methylation levels in genes with one-directional and bidirectional ASE. (A) Bins of average absolute values for allele-specific expression of all genes (n = 400) are shown on the x-axis, and the proportion of genes in each bin of ASE values are shown on the y-axis for genes with one-directional (black bars) and bidirectional (gray bars) ASE. The graph illustrates significantly larger ASE values in genes with bidirectional ASE than in genes with one-directional ASE (P = 1.4 × 10⁻¹²). (B) The variation in CpG site methylation for all CpG sites (n = 1306) is shown on the x-axis as bins of standard deviations (SD) for the methylation levels (beta-values from the GoldenGate assay) across samples for each individual CpG site. The proportion of CpG sites in each bin of SDs shown on the y-axis were obtained by dividing the number of CpG sites in each bin by the total number of CpG sites in genes with one-directional (black bars) and bidirectional (gray bars) ASE, respectively. The graph shows that genes with bidirectional ASE according to data from 267 SNPs display a larger variation in methylation levels than genes with one-directional ASE according to data from 203 SNPs (P = 2.2 × 10⁻⁵).

