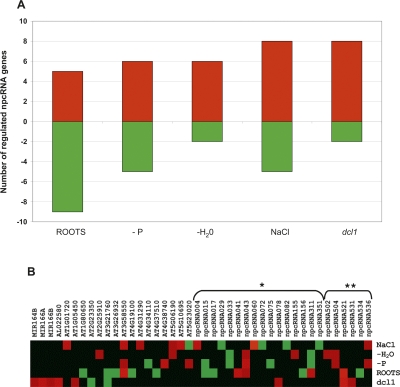
Figure 2.
Regulation of genes in the RIBOCHIP. (A) Total number of genes that were either induced (red bars) or repressed (green bars) in each analyzed condition. Conditions include expression in roots versus leaves (roots), roots of phosphate starved plants (−P), plants under water stress (−H2O), roots of plants treated with 150 mM NaCl (NaCl), and inflorescences of dcl1-9 mutants (dcl1). (B) Heat map showing expression level of each individual gene summarized in A. (*) npcRNAs identified by Hirsch et al. (2006); (**) npcRNAs identified in this study. Genes without asterisks correspond to additional regulated genes from the RIBOCHIP (annotation is indicated: coding sense counterparts of npcRNAs, RNA-binding proteins, miRNA precursors, and control genes).

