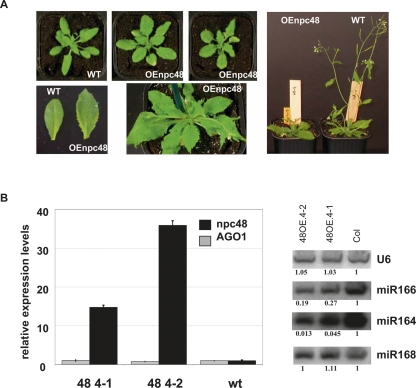
Figure 6.
Phenotypic and molecular analysis of transgenic plants overexpressing npc48. (A) Phenotype of Arabidopsis plants transformed with 35S∷npc48 construct. A wild-type (WT) plant (left) and two representative T1 35S∷npc48 plants (OEnpc48) from independent lines displaying a characteristic serrated leaf phenotype at different growth stages (central photos) are shown. Rosette leaves from WT and OEnpc 48 plants (lower left panel). Image of whole plants (right panel) illustrates the delayed flowering of OEnpc48 plants. (B) Expression analysis of npc48 and AGO1 mRNA from leaves of two npc48 overexpressing lines and control WT using real-time RT-PCR (left panel). Northern blot analyses of miR164, miR166, miR168, and U6 RNAs (right panel). Quantification is indicated setting the Col-0 value arbitrarily to 1 and normalizing to U6 values.

