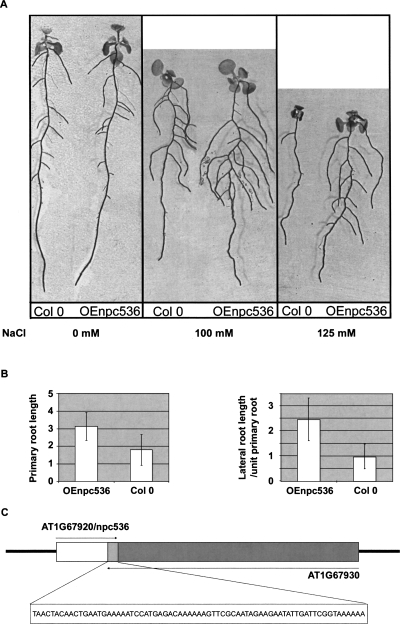
Figure 7.
Phenotypic and molecular analysis of transgenic plants overexpressing npcRNA536. Phenotype of Arabidopsis plants transformed with 35S∷npc536 constructs (Oenpc536). (A) Control and a representative OEnpc536 transgenic plants grown under the indicated salt stress conditions (0 mM, 100 mM, and 125 mM). (B) Quantification of primary root length and lateral root/primary root lengths in two independent transgenic OEnpc536 and control lines grown in 100 mM salt (n < 45 per experiment). SDs are indicated. These differences are statistically significant (t-test, 7 × 10⁻⁷), whereas no differences could be detected under normal growth conditions. (C) Schematic of the genomic positions and transcripts deriving from the npc536 (AT1G67920, white box) and AT1G67930 (dark gray box) loci. The nucleotide sequence of the overlapping region (light gray box) between the two transcripts is indicated.

