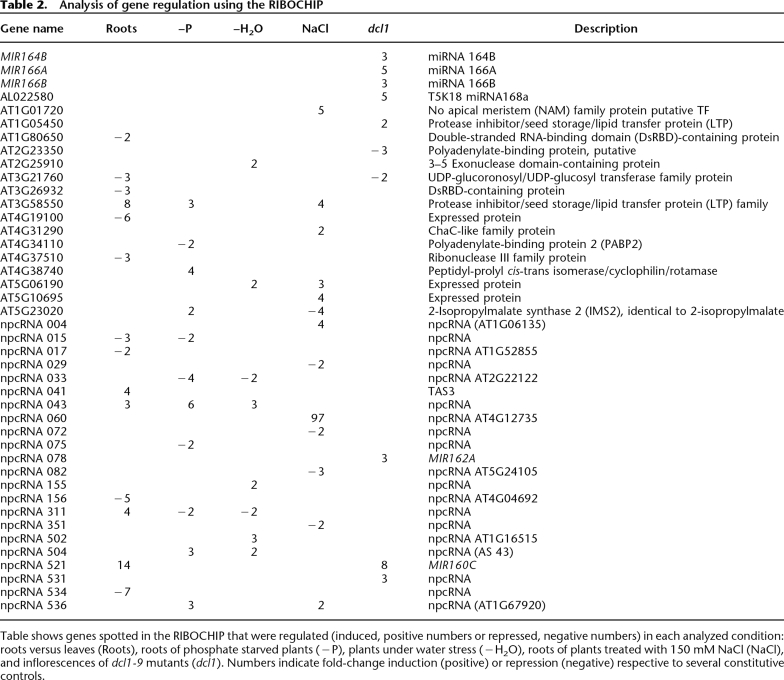
Table 2.
Analysis of gene regulation using the RIBOCHIP
Table shows genes spotted in the RIBOCHIP that were regulated (induced, positive numbers or repressed, negative numbers) in each analyzed condition: roots versus leaves (Roots), roots of phosphate starved plants (−P), plants under water stress (−H2O), roots of plants treated with 150 mM NaCl (NaCl), and inflorescences of dcl1-9 mutants (dcl1). Numbers indicate fold-change induction (positive) or repression (negative) respective to several constitutive controls.

