Figure 2.
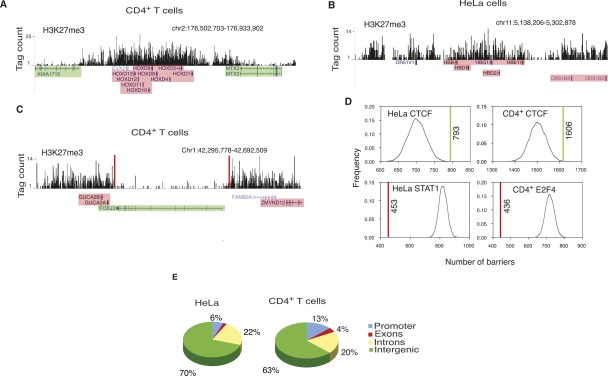
CTCF is enriched at the H3K27me3 domain boundaries. (A) Histone H3K27me3 pattern at the HOXD locus in CD4+ T cells; (B) beta-globin locus in HeLa cells shown as custom tracks on the UCSC genome browser (Karolchik et al. 2008). (Green) Expressed genes; (pink) silent genes. (C) A 400-kb region in chromosome 1 in CD4+ T cells. The barrier CTCF sites, shown as red bars, could be involved in maintaining the FOXJ3 gene free of H3K27me3, thus keeping it active, while the GUCA2A and GUCA2B genes that are within the H3K27me3 domain are silent. (Green) Expressed genes; (pink) silent genes. (D) In HeLa and CD4+ T cells, colocalization of the barrier CTCF sites with H3K27me3 domain boundaries (green lines) is higher compared with the colocalization between the randomly distributed sites and H3K27me3 domain boundaries (blue curve). The colocalization of the STAT1 and E2F4-binding sites (red line) with the H3K27me3 domain boundaries is lower than the colocalization between the randomly distributed sites and H3K27me3 domain boundaries (blue curve) in HeLa and CD4+ T cells. (E) Distribution of the barrier CTCF sites in HeLa and CD4+ T cells.

