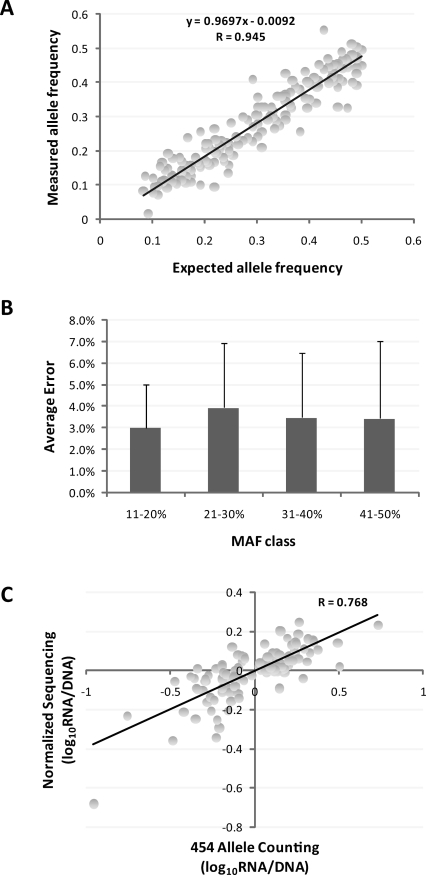
Figure 3.
(A) Comparison of expected and observed allele count (n = 278) in DNA pools derived from 55 CEU LCLs. (B) Average error with standard deviation (error bars) of allele frequencies derived from 454 counting as compared with known frequencies in the DNA pool. (C) Correlation of estimated fold difference (log10) in allele frequencies between cDNA and gDNA pools based on normalized sequencing (y-axis) and 454 allele counting (x-axis).

