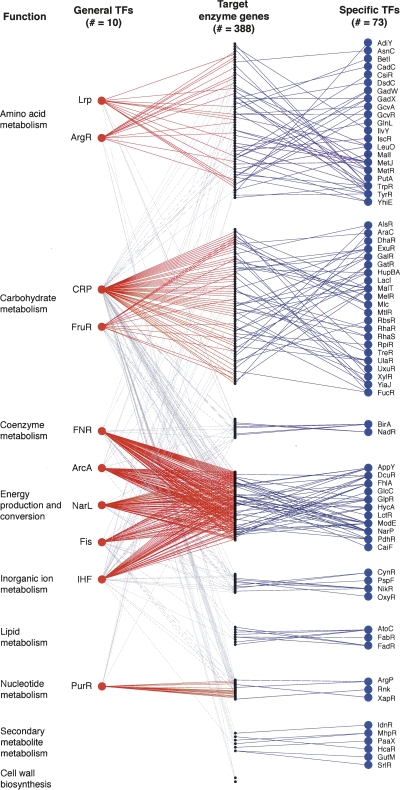
Figure 1.
Regulatory targets of general and specific TFs. Schematic representation of transcriptional regulation of E. coli small-molecule metabolism displaying general TFs (red circles), specific TFs (blue), and target enzyme genes (black). TFs are labeled with gene names, and enzymes are grouped according to their COG annotations. Regulatory interactions are shown as lines directed from general TF to functionally enriched target (red), general TF to non-enriched function (gray), and specific TF to target (blue).

