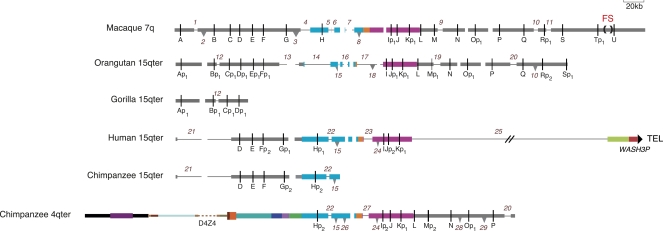
Figure 3.
Comparative map of the fission site region and its subtelomeric derivatives drawn to show all post-fission deletions and insertions involving >2.8 kb and OR pseudogenizing events. Thin black lines in the annotated sequence contigs indicate deletion of a sequence that is present in one or more other contigs. Inverted triangles indicate the presence of a sequence that is absent in one or more other contigs; the base of each triangle corresponds to the size of the inserted sequence. The direction of these changes (i.e., deletion vs. insertion) was inferred using parsimony in cases where more than one species shares an alternative structure and/or by examining the state of repeats at the breakpoints (Supplemental Table 4). These changes are numbered from left to right and down the figure; a change shared by more than one species carries the same number. In order to maximally align homologous sequences in the diagram, spaces are placed in contigs lacking each insertion at the position where an insertion is present in one or more other contigs. These spacers are not numbered. Rearrangement number 10 is shown as both insertion and deletion (INDEL), because its direction cannot be inferred from the available sequence. OR pseudogenes are indicated by “p,” and subscript numbers indicate independent or shared deactivating mutations. Not shown is the state of three gorilla OR genes, Ip3, J, and Kp1, which was determined by sequencing PCR products amplified from genomic DNA (Mefford et al. 2001, accession nos. EU685271–EU685273); FISH localizes these single-copy genes to gorilla 4q (Trask et al. 1998). The gorilla genome lacks gene H (Supplemental Table 3). The dashed turquoise bar in the orangutan 15q contig corresponds to a sequencing gap in insertion number 15. See the legend for Figure 2 for an explanation of other features.

