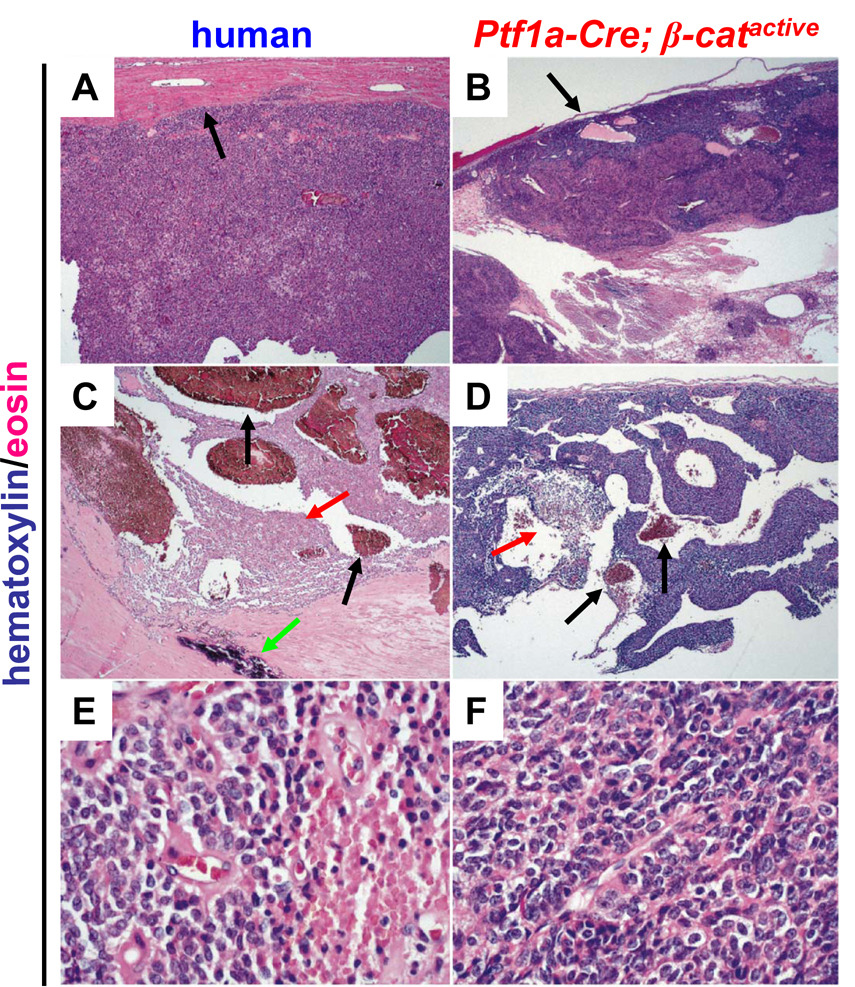
Figure 4. Tumors in Ptf1a-Cre; β-catactive mice are morphologically similar to human solid pseudopapillary tumors of the pancreas.
Slides were stained with hematoxylin and eosin to provide contrast. Low power view (x50) of human SPN (A) and murine tumor (B). Black arrows indicate tumor capsule (A,B). Low power view (x50) of human SPN (C) and murine tumor (D) with black arrows indicating areas of haemorrhage (C,D), red arrows indicating areas of necrosis (C,D), and green arrow to indicate a site of calcification (C). High power view (x400) of human SPN (E) and murine tumors (F). Images shown are representative samples from 13 human and 6 murine tumors analyzed; mice were 9 months old.

