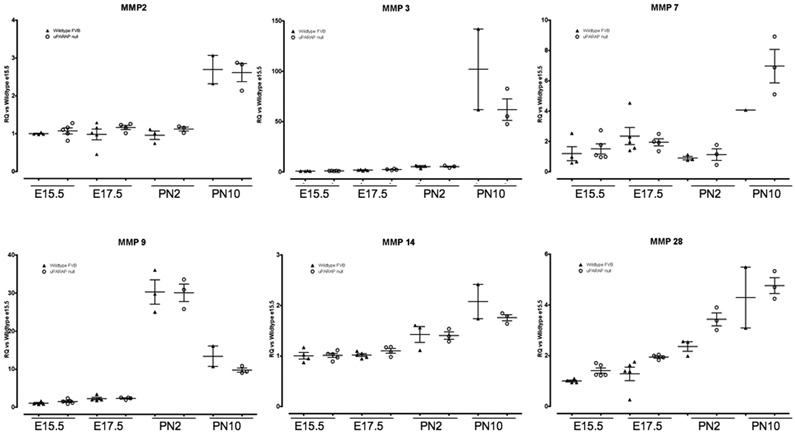
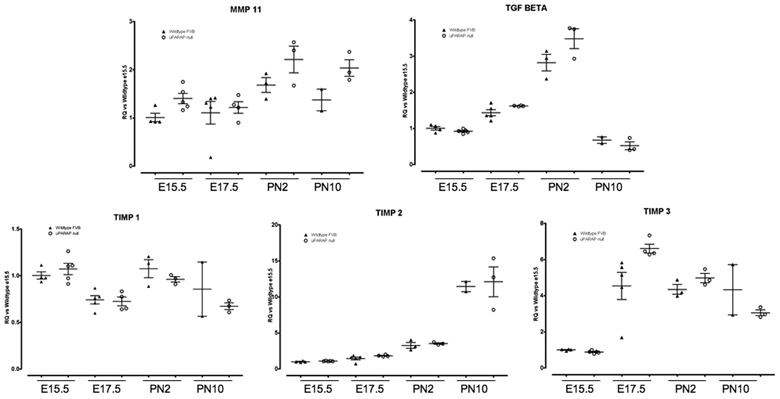
Figure 9.
Real time PCR analysis of MMPs, TIMPs and TGFβ1 expression during lung development in WT (▲) and uPARAP −/− (○) mice. Data were normalized to HPRT expression. Y axis represents fold increase compared to WT E15.5. Each point represents an individual embryo or mouse. Mean value ± SEM is indicated.


