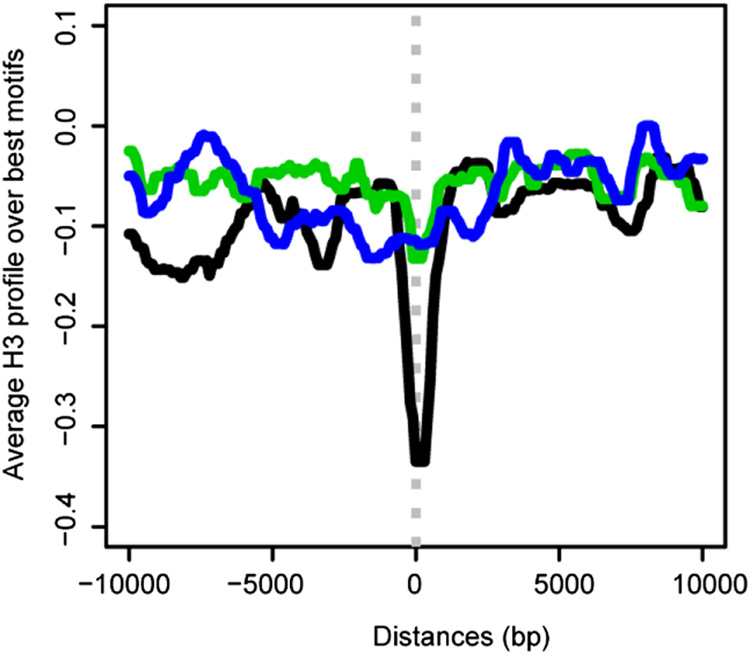
Figure 6. Histone H3 is depleted over MREs in chromatin entry sites.
Average H3 profile centered over the best MRE within 137 CES (black) shows clear depletion. In contrast, the best (green) or a random set (blue) of 137 MRE-motifs outside CES display a relatively flat profile. The histone occupancy data are from S2 and Clone8 cells (Larschan et al., 2007).

