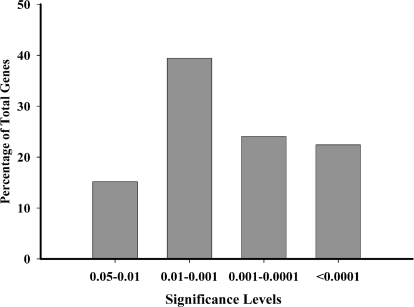
Figure 3.
A representation of the percentage of the STX-regulated genes within each of the four P value ranges. All 241 genes with a FC more than ±1.25 were divided into four categories based on their associated P value for the FDR. These categories are: P < 0.05 but more than 0.01; P < 0.01 but more than 0.001; P < 0.001 but more than 0.0001; and P < 0.0001.

