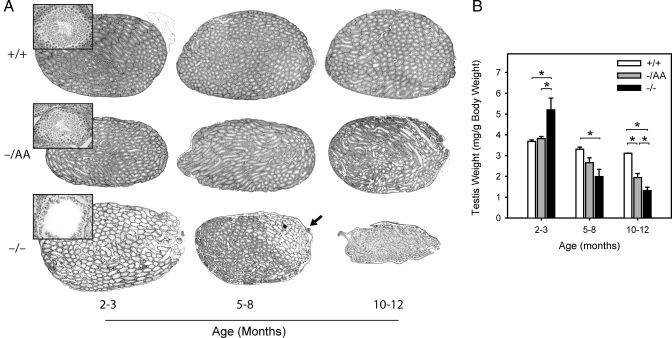
Figure 2.
Histological and morphological examination of the testis. For each animal, testes were weighed individually and prepared for histological examination. A, Representative longitudinal sections for each age and genotype, with insets showing a representative tubule from each section; B, testis weights (mean weight of both testes per animal). Bars represent mean ± sem of four to 12 animals. *, Statistical difference at P < 0.05.

