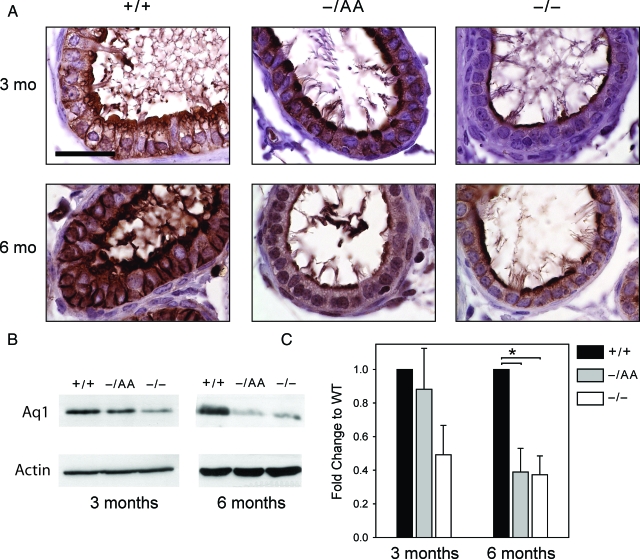
Figure 5.
Aq1 expression. A, Immunohistochemical staining for Aq1 in the efferent ducts. Scale bar, 30 μm. B, Representative Western blots. Each lane contains protein pooled from the efferent ducts of three to five animals. C, Western blot data from all animals. Each bar is the mean ± sem of three experiments, with each experiment representing a pool of three to five animals.

