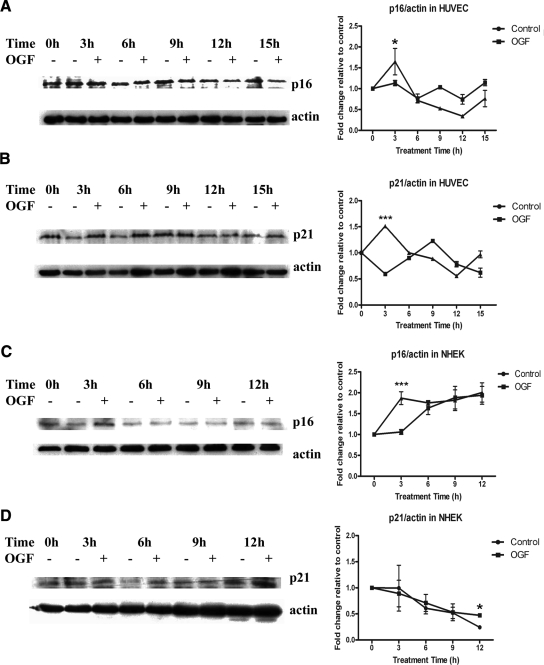
Figure 2.
OGF induced p16INK4a (A and C) and p21WAF1/CIP1 (B and D) expression in HUVECs and NHEKs. (A and C) HUVECs and NHEKs were treated with 10−6 M OGF or sterile water for 3, 6, 9, 12, or 15 h. Total proteins were resolved by SDS-PAGE, and blotted with p16INK4a-specific antibodies. Densitometric analysis of the Western blots was performed, and p16INK4a expression for OGF-treated cells is expressed relative to controls (0 h). The p16INK4a levels for HUVECs and NHEKs were significantly (* p < 0.05 and *** p < 0.001, respectively) elevated from the control group at 3 h. (B and D) HUVECs and NHEKs were treated with 10−6 M OGF or sterile water for 3, 6, 9, 12, or 15 h. Total proteins were resolved by SDS-PAGE and blotted with p21WAF1/CIP1-specific antibodies. Densitometric analysis of the Western blots was performed, and p21WAF1/CIP1 expression for OGF-treated cells is expressed relative to controls at 0 h. The p21WAF1/CIP1 level for HUVECs was significantly (*** p < 0.001) elevated from the control group at 3 h, whereas p21WAF1/CIP1 levels for NHEKs were significantly (p < 0.05) elevated from the control group at 12 h. Data represent means ± SEM for two or three independent experiments.

