Figure 2.

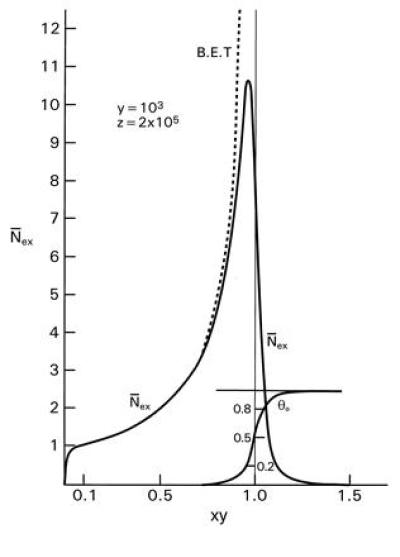
The solid curve labeled N̄ex is the case y = 103, z = 2 × 10⁵, plotted against xy. The dashed curve labeled B.E.T. is an approximation. The solid curve labeled θ0 (different scale) is θ0(xy) for the reference system with y = 103.

The solid curve labeled N̄ex is the case y = 103, z = 2 × 10⁵, plotted against xy. The dashed curve labeled B.E.T. is an approximation. The solid curve labeled θ0 (different scale) is θ0(xy) for the reference system with y = 103.