
Figure 10.
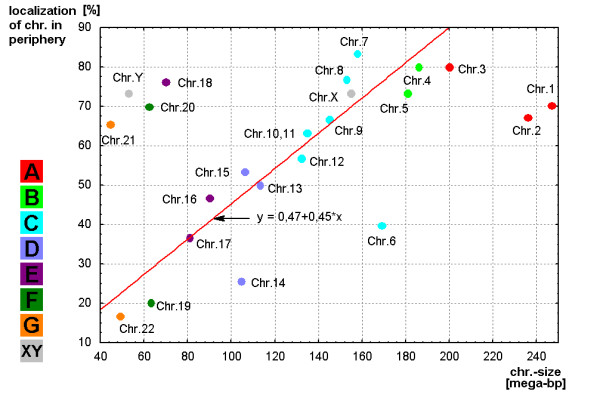
Result of regression analysis for the correlation of chromosomal distribution [center/periphery (Y-axis)] and the chromosome (chr.) size in mega-base pair (mega-bp). The regression is shown as a red line. The chromosomes are marked as dots in the corresponding colors of the groups A to G and gonosomes (X, Y), as specified in Figure 3.