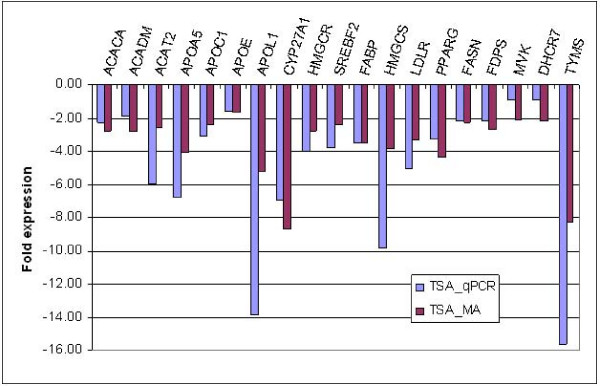
Figure 4.
Real Time qPCR verification of the gene expression levels of various genes involved in (A) lipid transport and fatty acid synthesis, (B) cholesterol metabolism and (C) pyrimidine biosynthesis in HepG2 cells. Fold expression is relative to ethanol control. TSA treatment showed down regulated expression of 14 genes by both qPCR and microarray.

