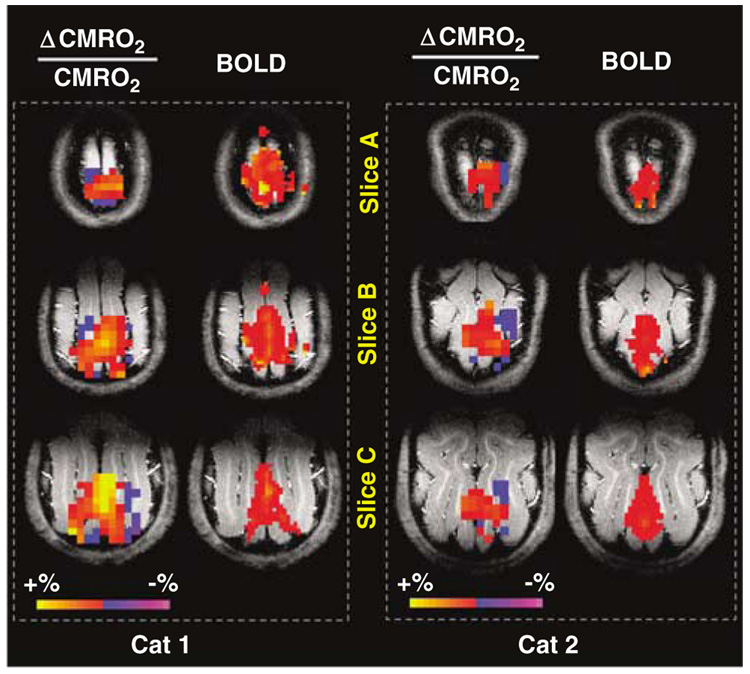
Figure 4.
Spatially compensated CMRO2 changes elevated by brain stimulation. Functional CMRO2 maps (show both positive and negative changes) and fMRI BOLD maps during visual stimulation from two representative cats. This figure shows that the CMRO2 increases in the central activated visual cortex regions are commonly accompanied by CMRO2 decreases in surrounding brain regions.

