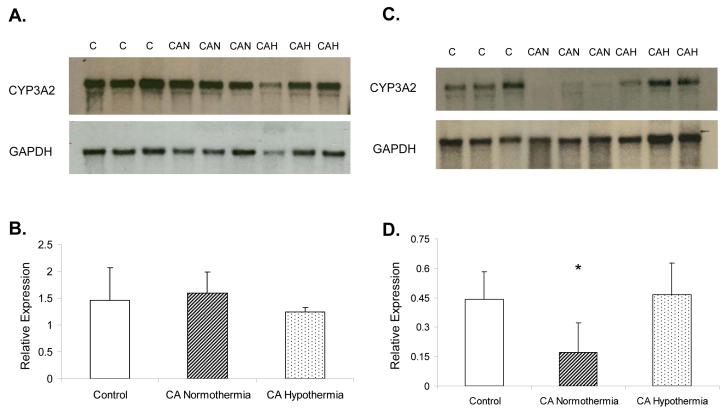
Figure 3.
CYP3A2 mRNA hepatic expression in control, CA normothermia, and CA hypothermia rat liver. Panel A shows CYP3A2 mRNA expression at 5 h after injury. Panel B shows no difference in band density between all 3 groups(n=6). Panel C shows CYP3A2 mRNA expression at 24h after injury. Panel D shows a significant decrease in CYP3A2 relative hepatic expression in the CA normothermia compared to control and CA hypothermia;*p<0.05.

