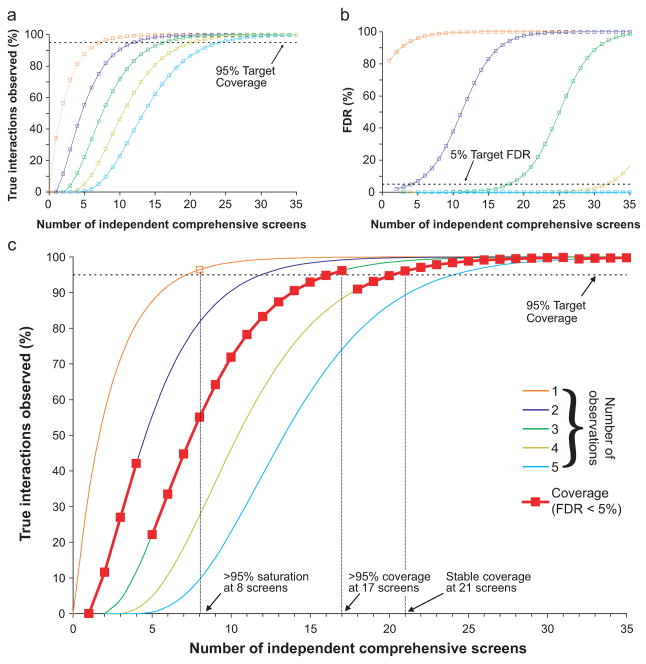
Figure 2. Analysis of the coverage and saturation of the fly interactome as a function of the number of independent screens.
(a) The percentage of true interactions that are observed >1 (orange), >2 (purple), >3 (green), >4 (yellow), and >5 (cyan) times as a function of the number of times they are tested with independent assays. Increasing the threshold of independent observations increases the number of independent assays needed to reach the 95% coverage target. (b) The false discovery rate (FDR) of interactions that are observed exactly once (orange), twice (purple), thrice (green), four times (yellow), and five times (cyan) as a function of the number of times they are tested with independent assays. To achieve FDR < 5% interactions should be observed at least twice when tested with < 5 independent assays, and at least three times when tested with 5–17 assays. (c) The effective coverage level at FDR < 5% is shown (red curve) by embedding the observation threshold from (b) into the curves of (a). While saturation is achieved after 8 screens, 21 screens are required for 95% coverage at FDR < 5%.

