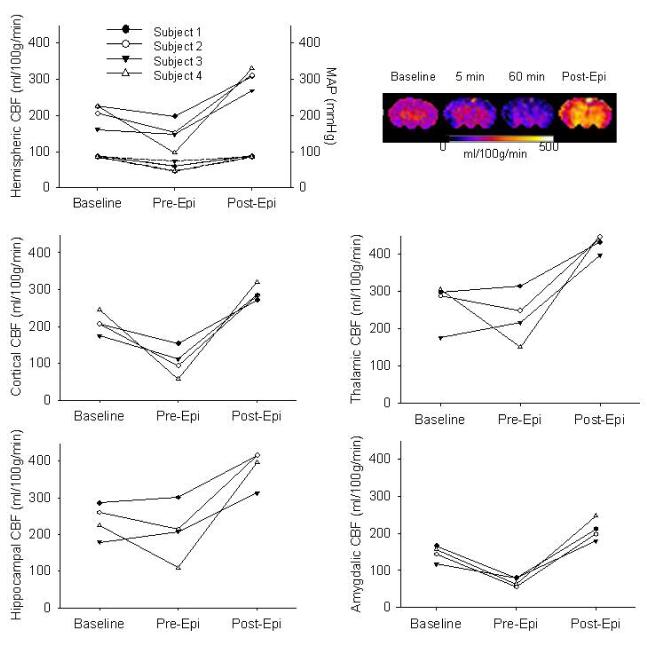
Figure 4.
Relationship between mean arterial pressure (MAP) and cerebral blood flow (CBF). CBF and MAP at baseline and after cardiac arrest, before infusion of epinephrine (Pre-Epi) and after infusion of epinephrine (Post-Epi). CBF color map for one representative animal at baseline and after cardiac arrest, before (1h) and after epinephrine infusion. Upper portion of the hemispheric CBF graph represents CBF, whereas the lower portion represents MAP for each subject.

