Figure 5.
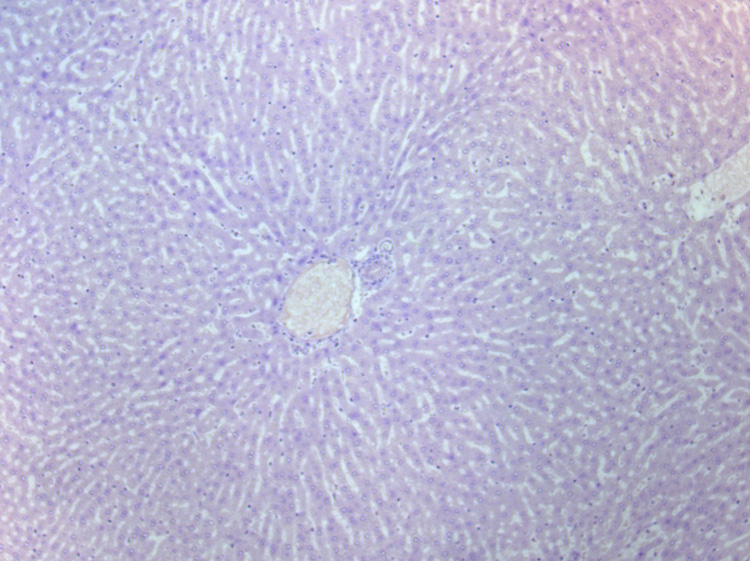
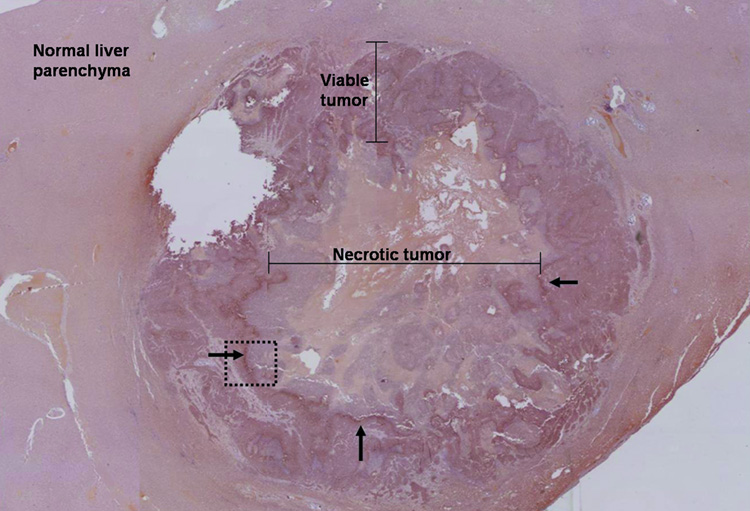
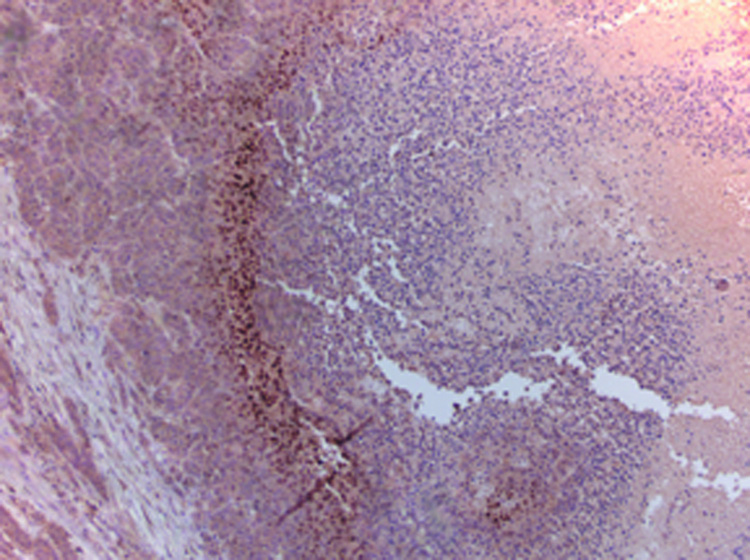
Immunohistochemical staining: (a) High-power photomicrograph (original magnification, X 20) of normal liver parenchyma adjacent to VX2 tumor (post-TAE) showing absence of HIF-1 α staining in these cells. (b) High-power photomicrograph (original magnification, X 2.5) of the whole tumor (post- TAE) showing the maximum intensity of HIF-1 α staining at the junction of the necrotic and the viable tumor tissue. Images were stitched together using Canon PhotoStitch 3.1 software. (c) High-power photomicrograph (original magnification, X 10) showing the dark brown nuclear staining, positive for the presence of HIF-1 α staining in these cells.


