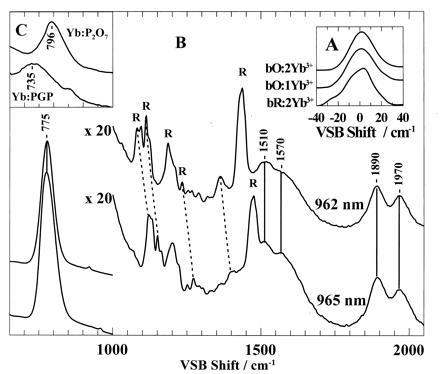
Figure 2.

Near infrared Yb3+ VSB spectra Yb3+ regenerated bR and bO. (A) Zero phonon lines for samples of bR containing two Yb3+ (Bottom; 870 nm excitation, 20 mW, 100 scans), bO containing one Yb3+ (Middle: 878 nm excitation, 650 mW, 1000 scans), and bO containing two Yb3+ atoms (Top: 884 nm excitation, 500 mW, 1000 scans). (B) VSB spectra of bR in the 700–2000 cm−1 VSB shift region, excited at 965 nm (Lower: 250 mW, 2000 scans) and 962 nm (Upper: 250 mW, 2000 scans). Obvious Raman bands from the retinal chromophore are designated R. (C) VSB bands arising from the phosphate symmetric P–O stretching mode of the PGP ( Lower: 886 nm, 180 mW, 200 scans) and P2O72− (Upper: 876 nm, 450 mW, 100 scans) Yb3+ complexes.
