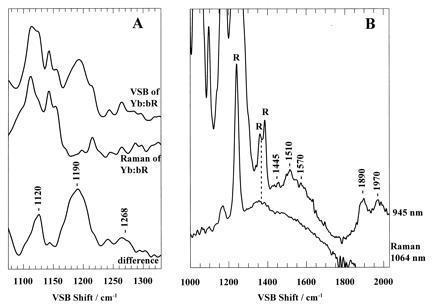
Figure 3.

(A) Near infrared Yb3+ VSB spectrum, excited at 965 nm, of bR containing two Yb3+ atoms per bR in the 1100–1300 cm−1 VSB shift region (Top: 250 mW, 2000 scans) and the Fourier transform Raman spectrum of the same bR sample excited at 1064 nm (Middle: 280 mW, 2000 scans); 1064 nm excitation results in the observation of essentially only the Raman contributions of the retinal chromophore. Subtracting the retinal Raman contributions (middle spectrum) from the top spectrum results in a difference spectrum (Bottom) revealing VSB bands previously hidden by the Raman contributions. (B) VSB spectrum of the same bR sample excited at 945 nm (Upper: 450 mW, 2000 scans). At this wavelength of excitation, the retinal Raman contributions are not present in the 1400–2000 cm−1 VSB shift spectral region. The Fourier transformed Raman spectrum of the same bR sample is shown for comparison (Lower: excitation 1064 nm, 280 mW, 2000 scans).
