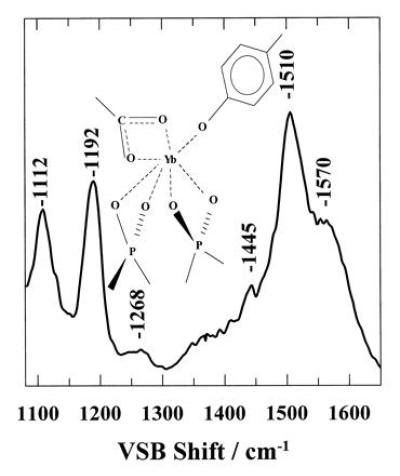
Figure 4.

VSB spectrum of bO containing one and two Yb3+ atoms per bO reconstructed from the two-dimensional correlation analysis. (Inset) Schematic diagram showing the possible configuration of the ligands of Yb3+ suggested by the results of this work.
