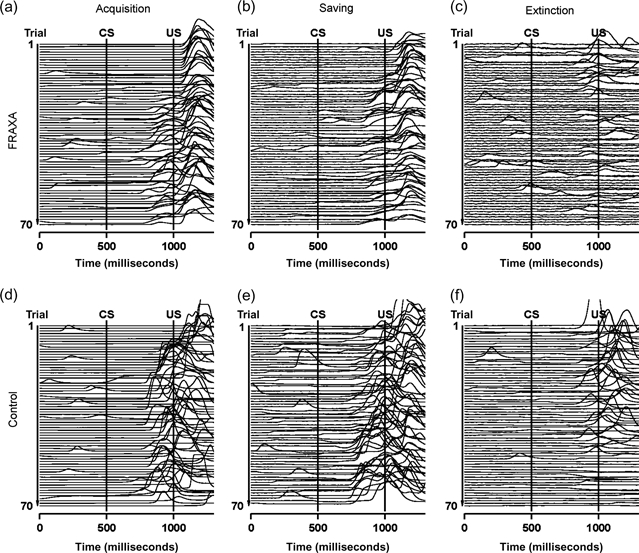
Figure 2.

Exemplary raw eyelid movement data of a subject with FRAXA (upper row) and a control subject (lower row) during the acquisition (a, d), savings (b, e) and extinction (c, f) experiments. Recordings of the 70 CS-only and paired trials are shown in order, starting with the first trial at the top. The two vertical lines indicate CS onset (at 500 milliseconds) and US onset (at 1000 milliseconds).
