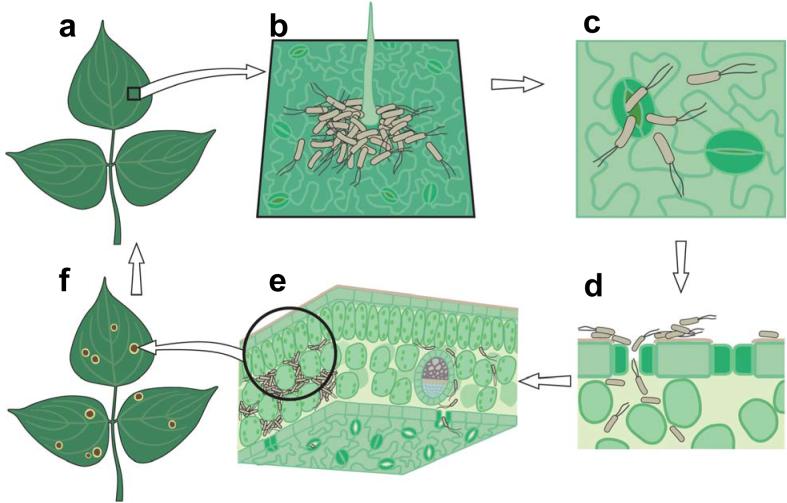
Figure 1.
A simplified diagram of the infection cycle of Pseudomonas syringae. (a) A diagram of healthy plant leaves. (b) Bacterial cells on a leaf surface, illustrating aggregation of some bacteria near a trichome. (c) Bacteria penetrating open stomate. (d) Cross section of a leaf showing bacteria colonizing the plant apoplast. (e) Extensive multiplication of bacteria in the apoplast of a leaf. (f) Visible disease-associated necrosis and chlorosis.

