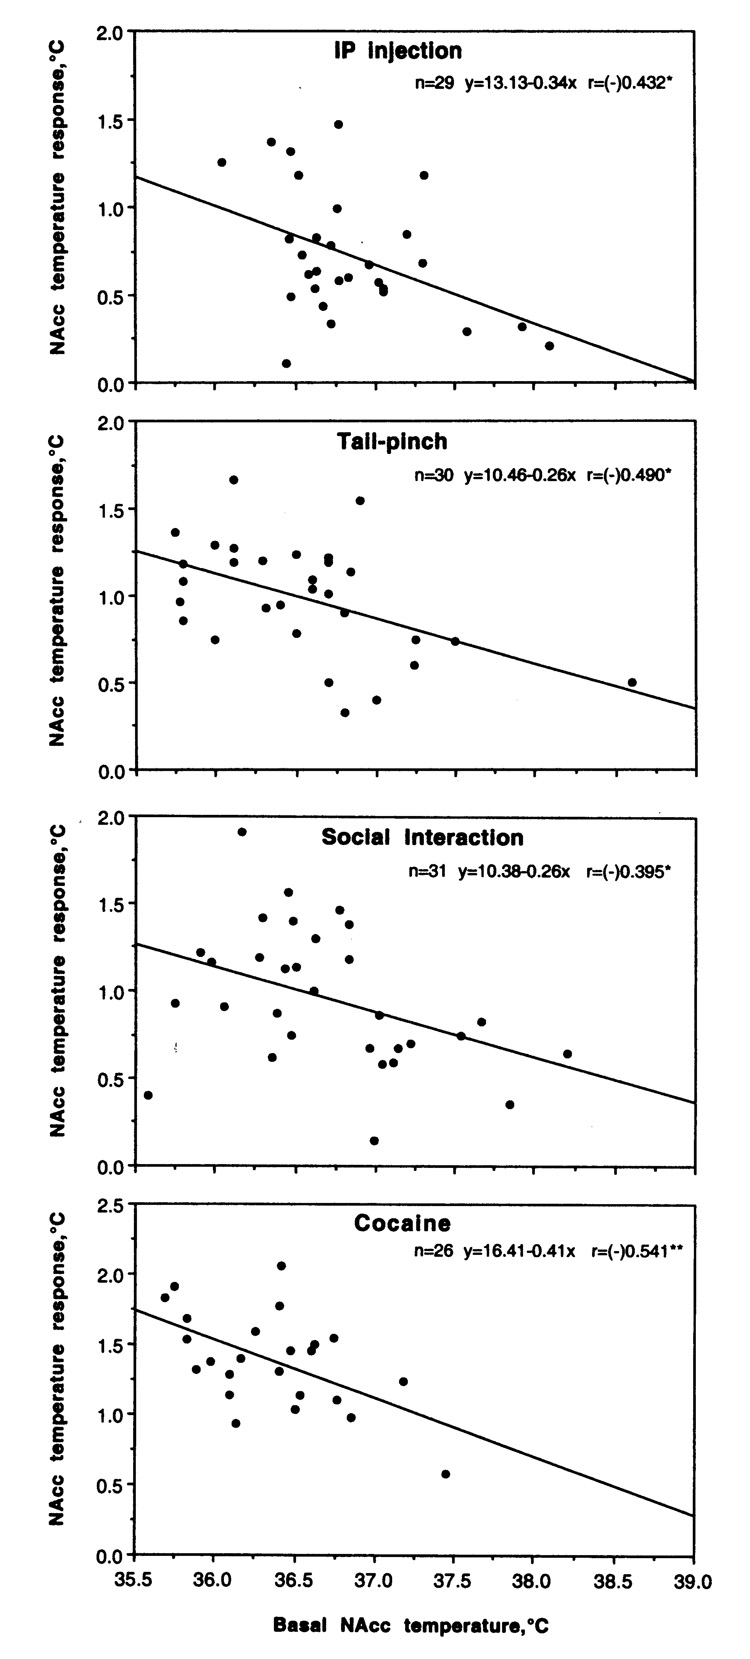
Fig. 3.
Correlative relationships between basal NAcc temperature and changes induced by the procedure of injection, tail-pinch, social interaction and iv cocaine. Each point represents basal and peak value. Each graph shows regression lines, regression equation, and correlation coefficient. Explanations are in the text.

