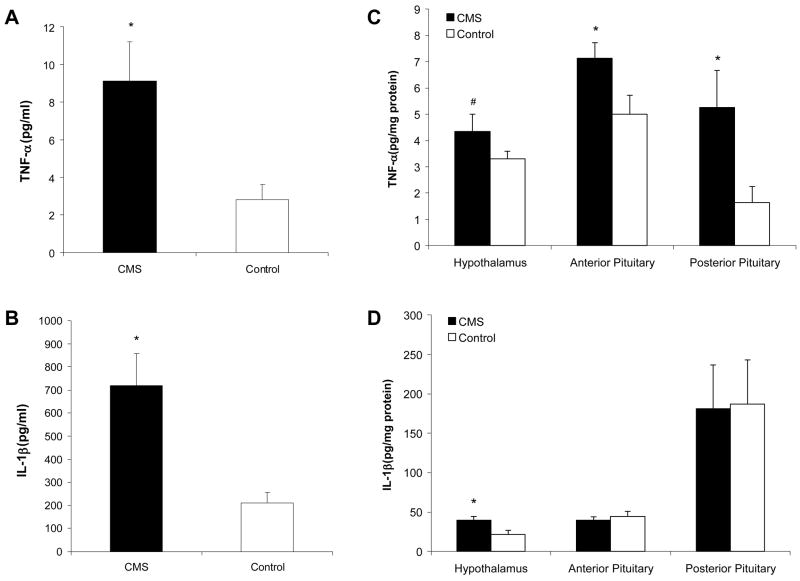
Figure 2.
Mean (+ SEM) levels of tumor necrosis factor (TNF)-α (Panels A and C) and interleukin (IL)-1β (Panels B and D) in the plasma (Panels A and B) and central nervous system (Panels C and D) in chronic mild stress (CMS) and control groups following 4 weeks of CMS. Both cytokine levels were increased in the plasma and specific central nervous system structures (*P < 0.05 vs. respective control value; #P < 0.1 vs. respective control value). Adapted from (Grippo et al., 2005a); used with permission.

