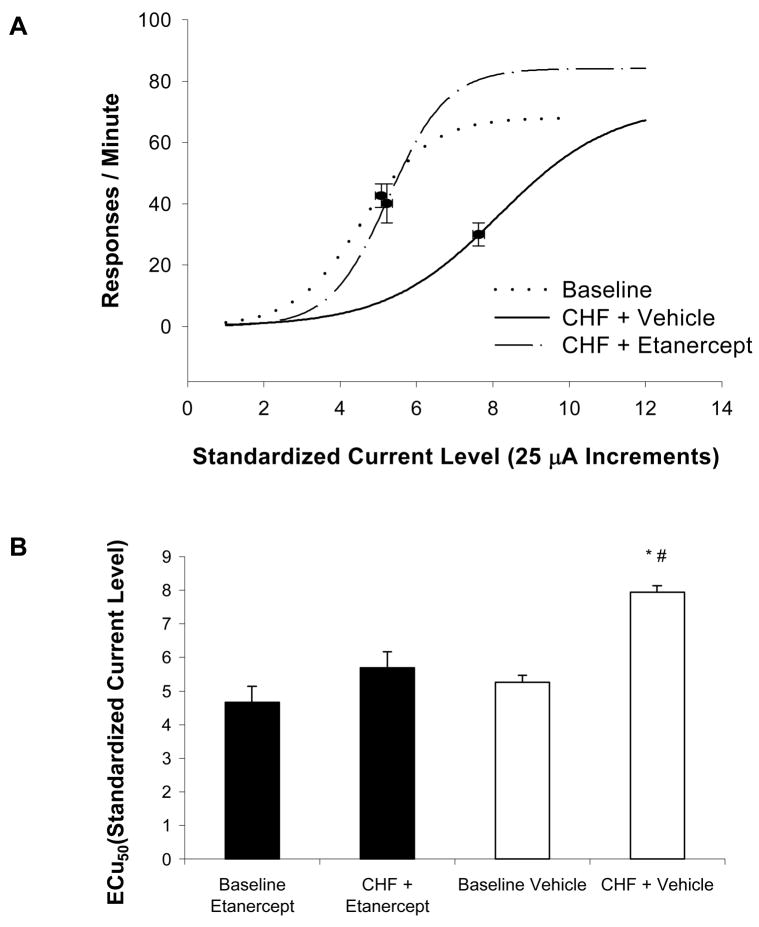
Figure 3.
Current-response functions illustrating the number of behavioral responses per minute at each level of standardized current (Panel A), and corresponding effective current 50 (ECu50) values showing the standardized current intensity that supports 50% of the maximum response rate (Panel B), in rats with congestive heart failure (CHF) before and 24 hours following etanercept or vehicle treatment. CHF animals treated with vehicle displayed a parallel rightward shift in the current-response function and a corresponding increase in ECu50 value; CHF animals treated with etanercept displayed values similar to this group’s respective baseline values and those of the control group (*P < 0.05 vs. Baseline Vehicle; #P < 0.05 vs. CHF + Etanercept). Modified from (Grippo et al., 2003b); used with permission.

