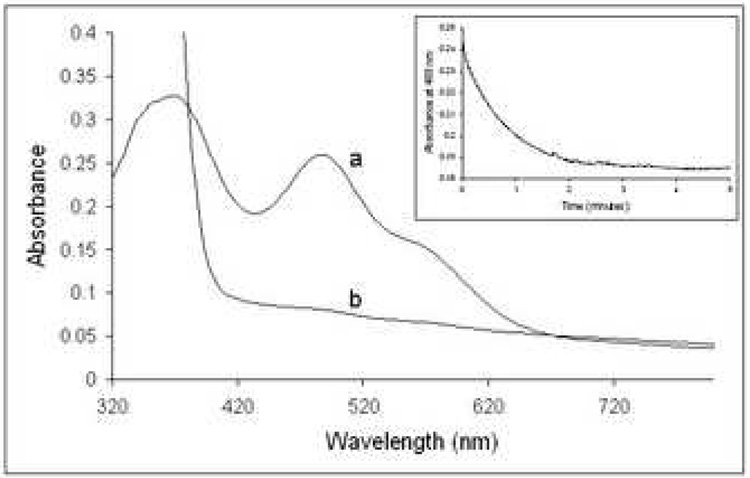
Figure 5.
Anaerobic reduction of TA0289 by the E. coli NorW in the presence of NADH. A 24 µM anaerobic sample of TA0289 in a solution containing 50 mM Hepes-Na+ (pH 7.5), 0.2 M NaCl, 10% glycerol and 1 µM NorW was scanned (trace a). Reduction of TA0289 was achieved by the anaerobic addition of 200 µM NADH. The fully reduced spectrum is trace b. INSET: An absorbance trace at 488 nm following the time course for the reduction of 19 µM TA0289 in the presence of 200 µM NADH and 1 µM NorW in the same buffer, obtained from a single wavelength stopped flow experiment. The dotted line represents a fitted first order curve with a rate constant of 1.3 min−1.

