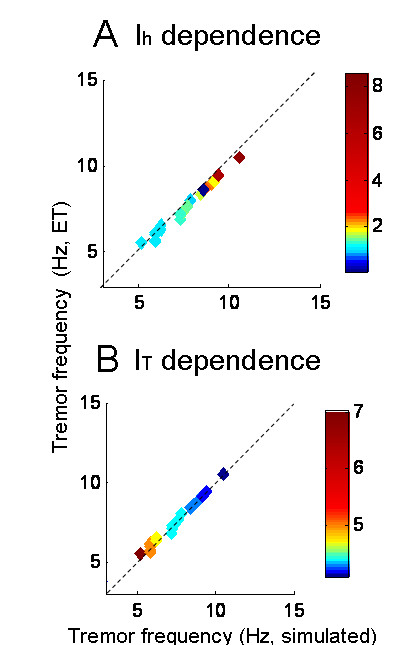
Figure 4.

Strong correlation between the frequency of simulated tremor and corresponding postural tremor frequency in the ET patients. Note that all the data points fall along the equality line suggesting a strong correlation. The color coding illustrates the value of IT or Ih in the model that was required to simulate tremor from each ET patient. (A) The higher values of Ih correspond to higher amplitude as well as frequency of tremor. The range of modeled Ih conductances to simulate the ET is 10 – 80 times larger than its physiological value. (B) The higher values of IT in the model corresponds to the lower frequency. In contrast to Ih, the range of IT to simulate ET is only 1.3 – 3 times higher than its physiological value. These results imply that tremor frequency amongst ET is predominantly determined by the Ih (as compared with IT).
