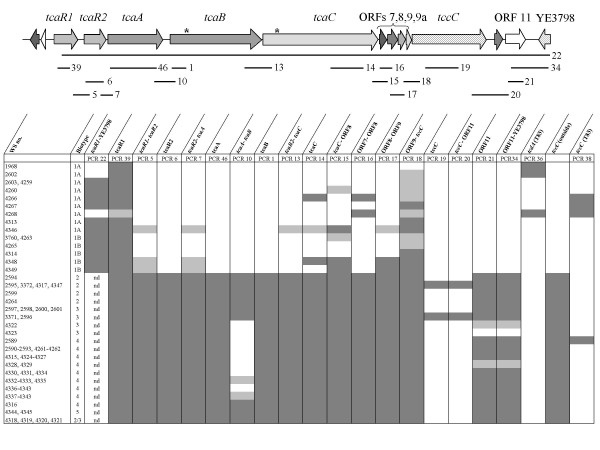
Figure 3.
Distribution of the tc-PAIYe in Y. enterocolitica strains. Strains investigated are described in Table 3. The lines below the tc-PAIYe are in scale and mark the fragments amplified by PCR. The PCR numbers correspond to those indicated in Additional file 1. Asterisks mark frameshifts in tcaB and tcaC. Dark grey: fragment amplification, light grey: biased results, white: no amplification; nd, not defined, e.g. no PCR was performed. See text for further details.

