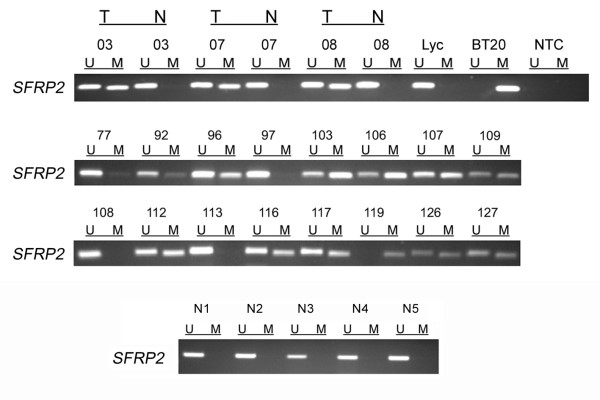
Figure 3.
SFRP2 methylation analysis of primary breast cancer specimens. MSP was performed on bisulfite-treated DNA from primary invasive breast cancer tissues. MSP results from 19 representative patient samples are shown. DNA bands in lanes labeled with U indicate PCR products amplified with primers recognizing the unmethylated SFRP2 promoter sequence. DNA bands in lanes labeled with M represent amplified products with methylation-specific primers. In addition, five representative normal cancer-unrelated breast tissues (N1 – N5) are shown. DNA from the breast cancer cell line BT20 and lymphocyte DNA from a healthy donor (Lyc) served as positive controls for MSP. NTC designates the no template control; T indicates tumor tissue; N indicates normal breast tissue.

