
Figure 1. AChE inhibitors cause a reduction of NMDAR-EPSC amplitudes in cortical pyramidal neurons.
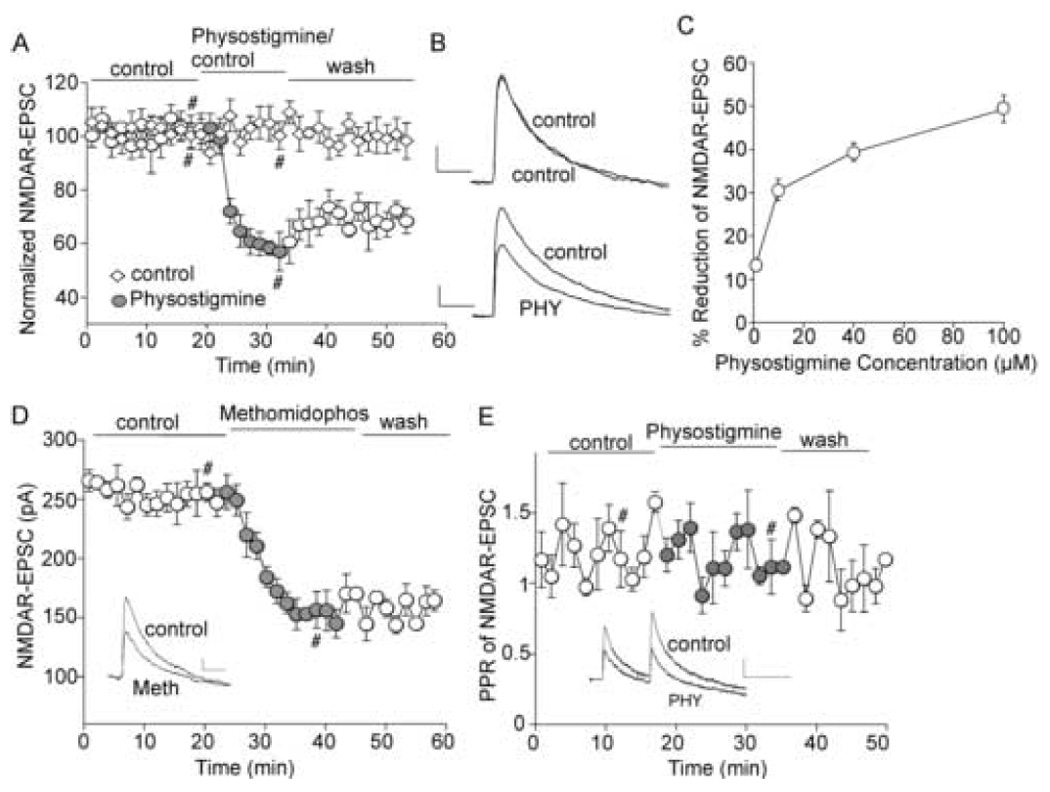
A, Plot of normalized peak NMDAR-EPSC amplitudes as a function of time and drug (the AChE inhibitor physostigmine, 40 µM, or control ACSF) application in two representative PFC pyramidal neurons. B. Representative traces of NMDAR-EPSC from the records used to construct A (at time points denoted by #). Scale bars: 20pA/100ms. C. Dose response curve showing the effect of physostigmine on NMDAR-EPSC. D. Plot of peak NMDAR-EPSC amplitudes as a function of time and methomidophos (50 µM, another AChE inhibitor) application in a representative PFC pyramidal neuron. E. Plot of paired pulse ratio (PPR) of NMDAR-EPSC as a function of time and drug application. Inset (D, E), representative traces of NMDAR-EPSC (at time points denoted by #). Scale bars: 20pA/100ms.