
Figure 2. The reduction of NMDAR-EPSC by physostigmine is mainly mediated by nicotinic acetylcholine receptors.
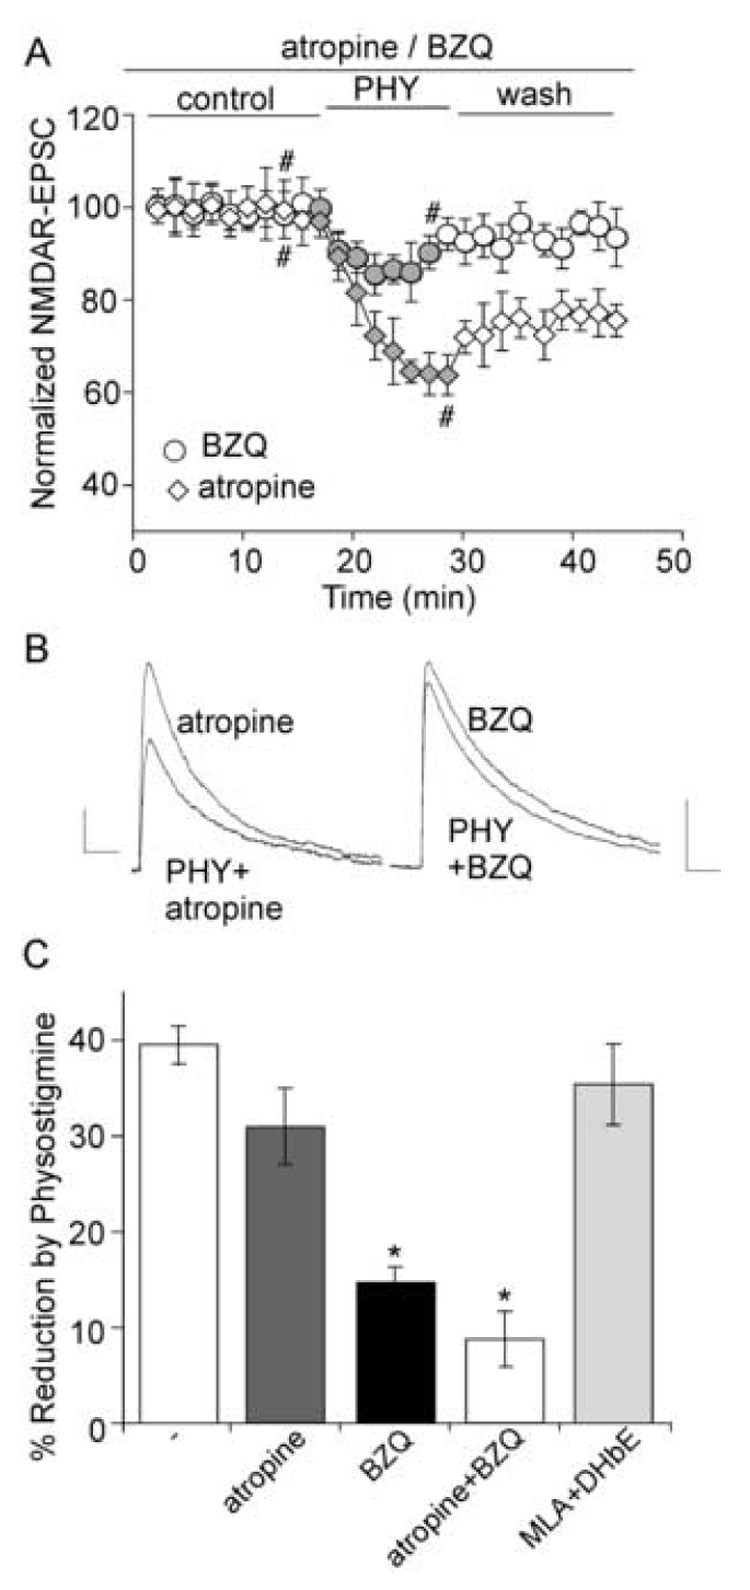
A. Plot of normalized NMDAR-EPSC amplitudes as a function of time and physostigmine (40 µM) application in neurons treated with either atropine (50 µM) or benzoquinonium (BZQ, 50 µM). B. Current traces taken from the records used to construct A (at time points denoted by #). Scale bars: 10pA/100ms. C. Bar plot summary showing the percentage reduction of NMDAR-EPSC by physostigmine in the presence of atropine, BZQ, atropine + BZQ, or MLA (10 µM) + DHβE (0.1 µM). *: p < 0.001, t-test.