
Figure 3. The effect of physostigmine on NMDAR-EPSC is through a mechanism depending on Ca2+.
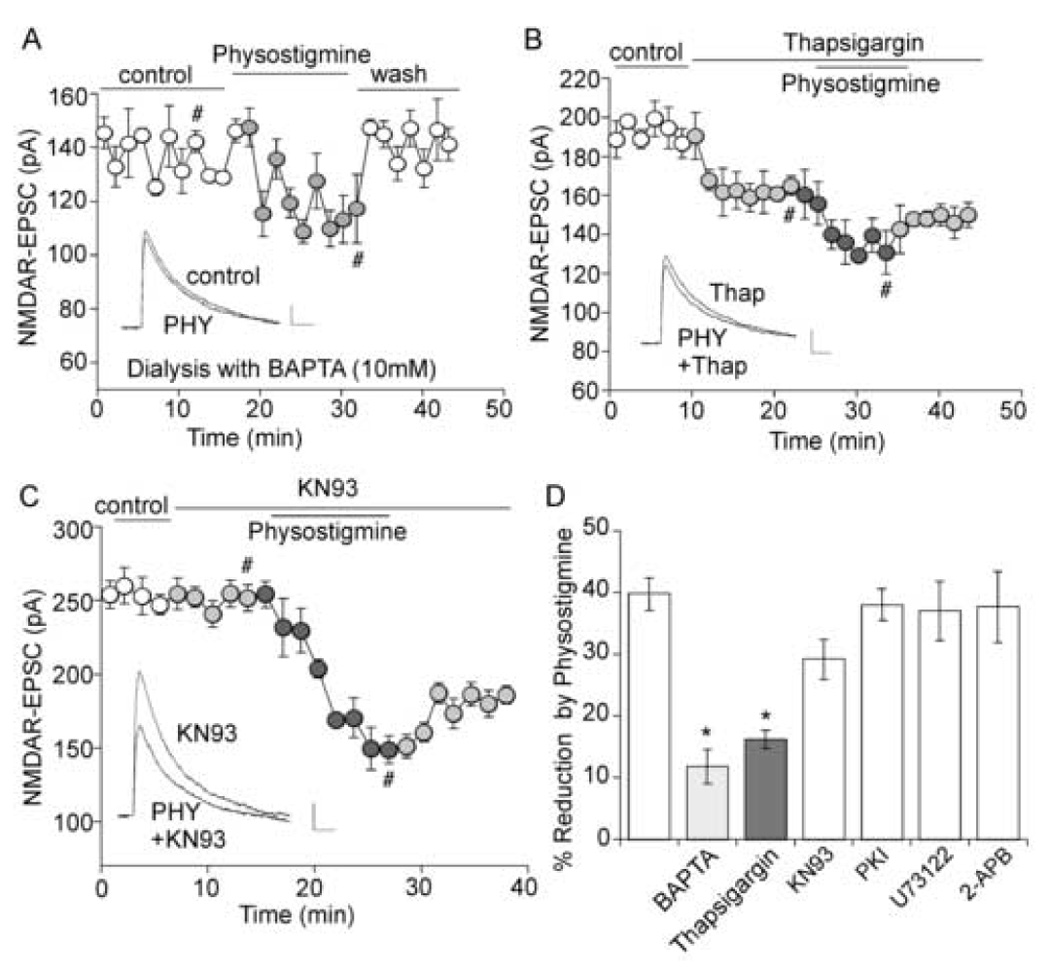
A. Plot of NMDAR-EPSC as a function of time and physostigmine (40 µM) application in a neuron loaded with BAPTA (10 mM). Inset, representative current traces (at time points denoted by #). Scale bars: 20pA/100ms. B, C. Plot of NMDAR-EPSC as a function of time and drug application. Note that thapsigargin (10 µM, B), but not KN93 (10 µM, C), prevented the effect of physostigmine. Inset (B, C), representative current traces (at time points denoted by #). Scale bars: 10pA/100ms. D. Bar plot summary showing the percentage reduction of NMDAR-EPSC by physostigmine in neurons treated with different agents. *: p < 0.005, t-test.