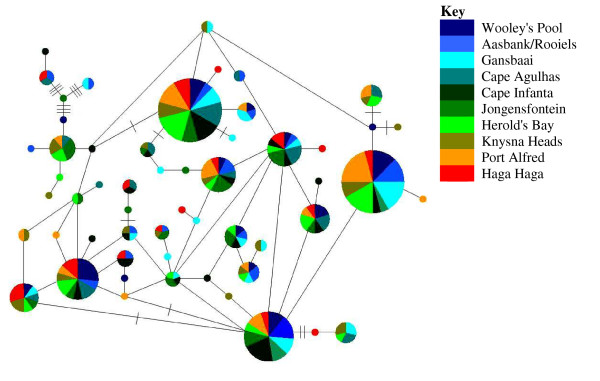
Figure 2.
Haplotype network for C. caffer. Size of the circles are representative of the number of individuals with that haplotype. The smallest circles represent a haplotype frequency of one. Each connecting line represents one mutation step between haplotypes and perpendicular lines are representative of an additional mutational change.

