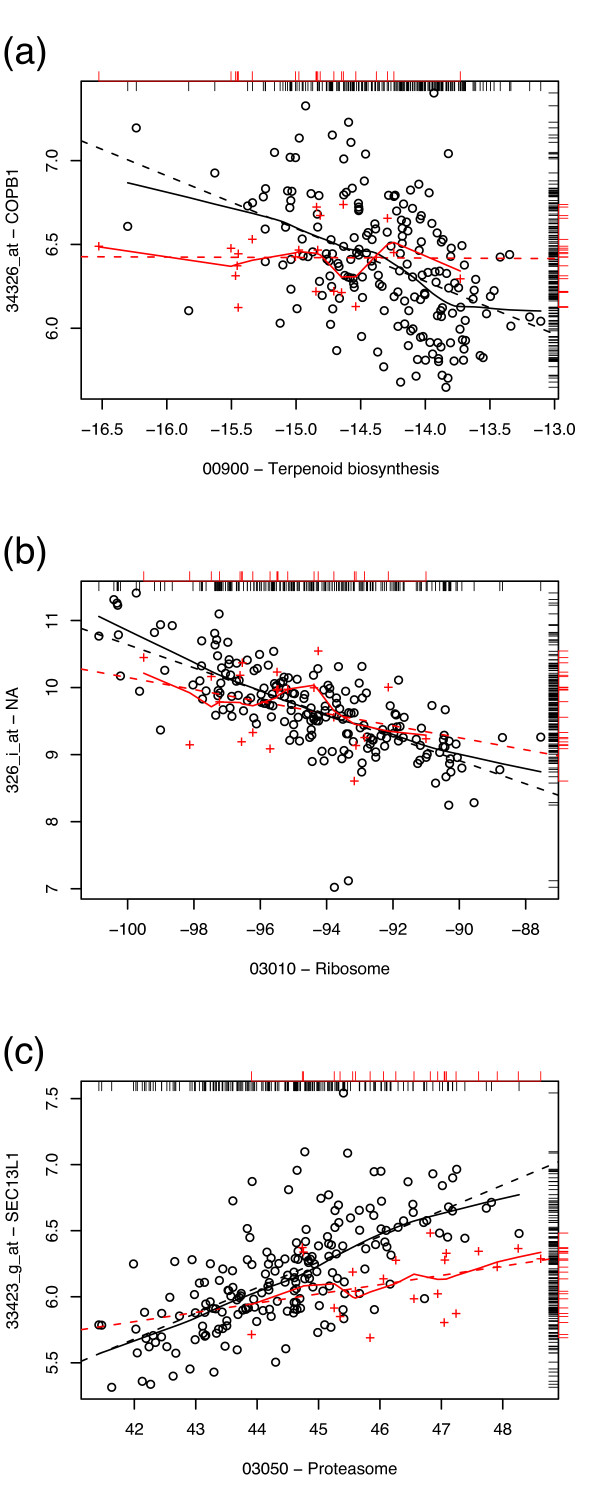
Figure 7.
High SGPC pairs, lung data. Sample plots of gene expression vs. pathway expression in adenocarcinoma (black circles) and squamous cell carcinoma (red crosses) of the lung. Loess curves (solid line) and least squares linear fits (dashed line) for the two classes are given as a visual guide. Marginal distributions of the data are given as rug plots (black, inward for adenocarcinoma samples; red, outward for SCC samples). From top to bottom: (a) coatomer protein complex (COPB1) vs. terpenoid biosynthesis pathway (SGPC = 0.450); (b) Ribosomal protein S20 (RPS20, 326_i_at) vs. ribosome pathway (SGPC = 0.507); (c) Sec13-like protein (SEC13) vs. proteasome pathway (SGPC = 0.411).

