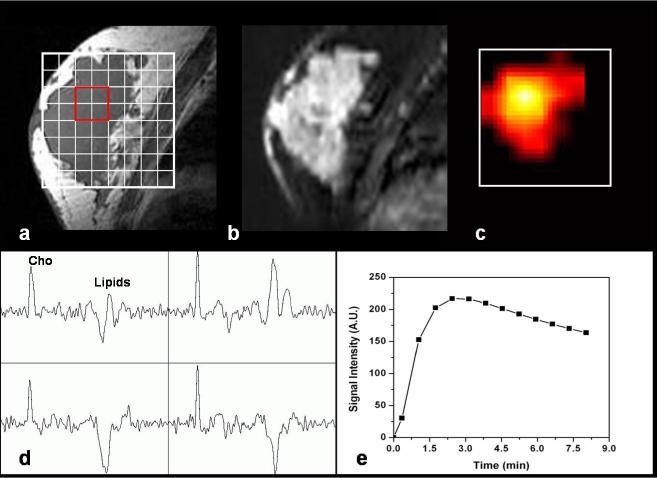
Figure 2.
MR imaging and chemical-shift imaging from a 58-year-old patient (#2) with an invasive ductal carcinoma. (a) The sagittal T1-weighted pre-contrast MR image shows one large lesion with hypointense signal. (b) Heterogeneous signal intensity is shown on the sagittal view enhancement map. This image was reformatted from the axial subtraction images, thus had a low spatial resolution. (c) The metabolite map demonstrates a regional Cho distribution on the sagittal pre-contrast MR image. (d) Breast MR spectra obtained from 2×2 voxels (red outline) in the center of the tumor show high Cho peaks (mean SNR = 22.4). (e) The signal enhancement time course measured from tissues corresponding to the highest Cho voxel shows the malignant pattern with washout during the delayed phase.

