Figure 8.
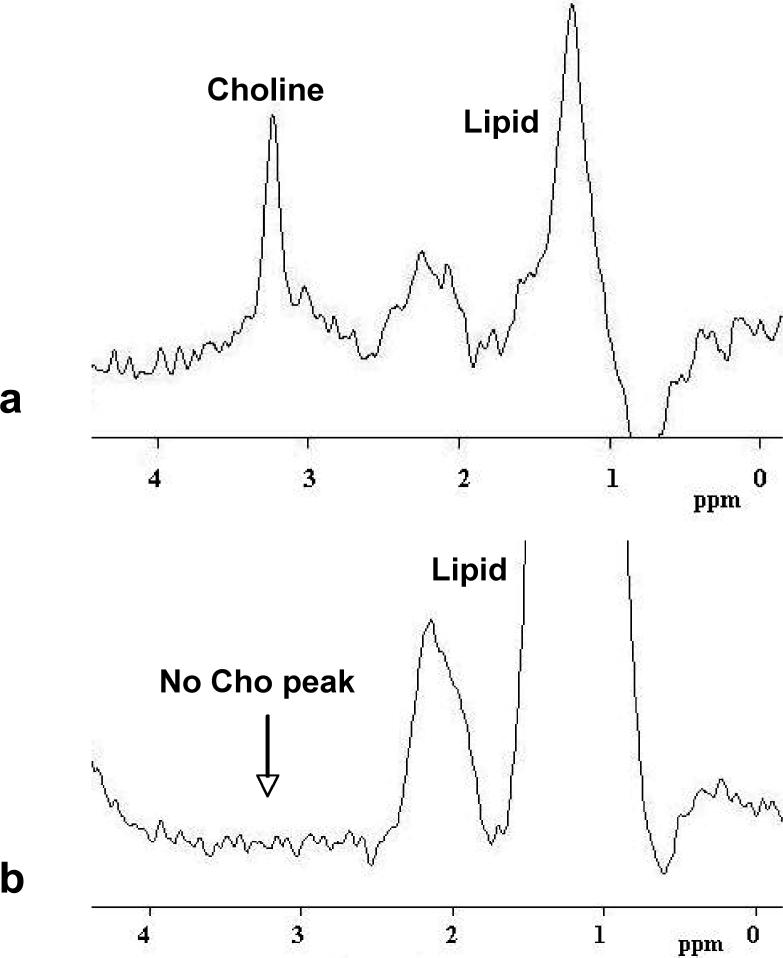
a: An example of MRS spectrum showing an identifiable Choline peak at 3.2 ppm. This spectrum was measured from the largest lesion shown in Figure 5. b: An example of MRS spectrum without an identifiable Choline peak around 3.2 ppm. This spectrum was measured from the lesion shown in Figure 1.

