
Fig. 4.
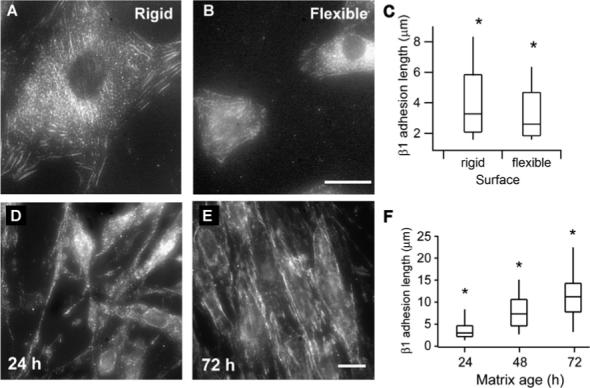
Staining for β1 integrin on rigid and flexible polyacrylamide surfaces and in 3D matrices. Top: Cells on polyacrylamide gels. (A) Vigorous recruitment of β1 into fibrillar adhesions on rigid surfaces. (B) Reduced integrin β1 staining is visible on flexible surfaces in structures reminiscent of fibrillar adhesions. Scale bar is 15 μm. (C) Box and whisker plot of adhesion lengths on rigid (n = 242) and flexible surfaces (n = 309). The top and bottom vertical lines denote the 98th and 2nd percentile values. Distributions are significantly different, the * denotes p < 0.001. Bottom: Cells on glass. (D–F) Typical adhesion structures containing β1 integrins shown over time. (D) At 24 h very few adhesion-like structures were present and those tended to be very short. (E) Over time the β1-containing adhesions became increasingly elon-gated, seeming to reach a kind of steady state by 72 h. Scale bar is 10 mm. (F) Box and whisker plots of integrin lengths at different timepoints. The * denotes a significance of p < 0.001; N = 195, 200, 160, 160, and 143 for each time point, respectively.