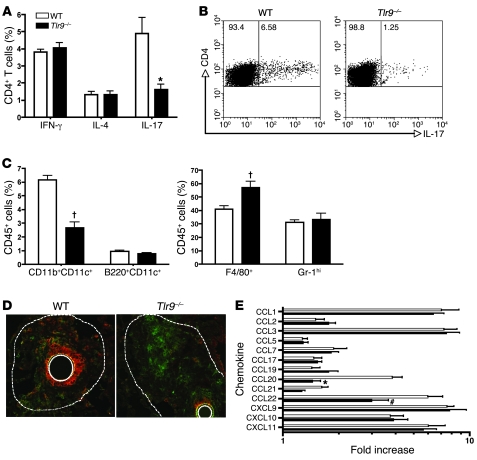
Figure 2. Impaired Th17 cell phenotype and migration of mDCs in Tlr9–/– mice during pulmonary granuloma formation.
(A) FACS analysis of intracellular staining of CD4+ cells for IFN-γ, IL-4, and IL-17. Data represent mean ± SEM. *P < 0.01 compared with WT mice. Experiments were performed 3 times with similar results. (B) FACS profile of CD4+ T cells from lungs was analyzed by intracellular staining of IL-17. Displayed in the dot plots are cells gated on CD4+ lymphocyte population by forward scattering and side scattering. The numbers in the dot plots are percentages of IL-17– cells (left gate) and IL-17+ cells (right gate) in the CD4+ lymphocyte population. Shown are representative FACS plots from a total of 4 mice per group. (C) FACS analysis of lung DCs, macrophages, and neutrophils isolated from day 4 PPD-bead challenged mice (n = 4). †P < 0.02 compared with WT mice. Data shown are mean ± SEM and are from a representative experiment of 2 independent experiments. (D) Confocal immunofluorescent examination of pulmonary granulomas showed fewer CD11c+ cells (red) and increased F4/80+ cells (green) in Tlr9–/– mice. Shown are representative sections from 1 mouse of 4 per group. Dotted lines indicate the areas containing a PPD bead and the granuloma. Original magnification, ×200. (E) Quantitative real-time PCR (TaqMan) was performed to measure the transcript levels of chemokine in whole lung at day 4 after the initiation of lung granuloma. #P < 0.05; *P < 0.01. Data shown indicate mean ± SEM and are from a representative experiment of 3 independent experiments. Each time point indicates at least 4–6 mice per group.

