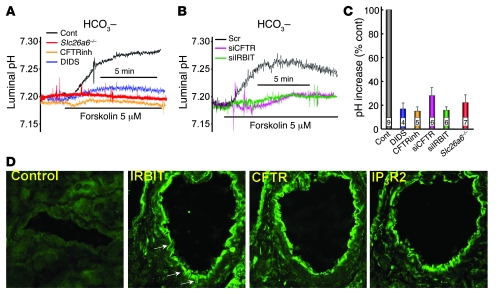
Figure 3. Properties of HCO3– secretion by the pancreatic duct.
(A) The changes in luminal pH of sealed ducts perfused with HCO3–-buffered media (black trace), containing 0.5 mM DIDS (blue trace), or 10 μM CFTRinh-172 (orange trace) are shown. The red trace shows luminal pH of sealed ducts from Slc26a6–/– mice. (B) The changes in luminal pH of sealed ducts perfused with HCO3–-buffered media and treated with scrambled (black trace), CFTR (purple trace), or IRBIT (green trace) siRNA are shown. (C) Summary (mean ± SEM) of increase in pHi, as in A. Numbers within bars denote number of experiments. (D) Immunolocalization of IRBIT, CFTR and IP3R2. The first image is the control in which primary antibodies were omitted. Original magnification, ×1,000.

