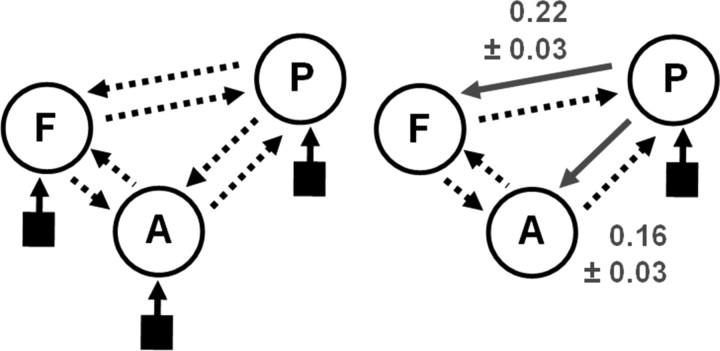
Figure 2.
Results from the DCM analysis. The basic model structure for the DCM analysis is shown on the left, with possible bidirectional connections between each of the three regions shown as dotted arrows (P, pSTS; A, aSTS; F, IFG). Each model was crossed with four different inputs sites (black squares); into A only, P only, both A and P, or F only. Of the 216 models generated, the wining model is shown on the right. Connections modulated by intelligibility are shown as solid gray arrows with the average modulatory parameter estimates ±SEs over subjects shown alongside.

